Kansas Geological Survey, Current Research in Earth Sciences, Bulletin 241, part 3
Prev Page--Plattsburg Limestone || Next Page--Plattsburg Limestone, cont.
![]()
![]()
![]()
Kansas Geological Survey, Current Research in Earth Sciences, Bulletin 241, part 3
Prev Page--Plattsburg Limestone ||
Next Page--Plattsburg Limestone, cont.
![]()
A site map of the study area shows the relationship between the GPR profile and the outcrop (fig. 7). Uninterpreted and interpreted photomosaics and GPR data from the site are shown in figs. 9 and 10. The data were plotted to 50 ns below the surface, corresponding to a depth of 3.0 m (9.8 ft), assuming an average one-way velocity of 0.12 m (0.39 ft)/ns (based on reflection travel-times and unit thickness measured on the outcrop). Changes in relative elevation did not have an appreciable effect on limestone velocities, except when argillaceous units (which have slightly slower GPR velocity) were encountered at the surface.
Fig. 9A--Uninterpreted photomosaic of the Plattsburg Limestone study site. For enlarged view, click on section of image.
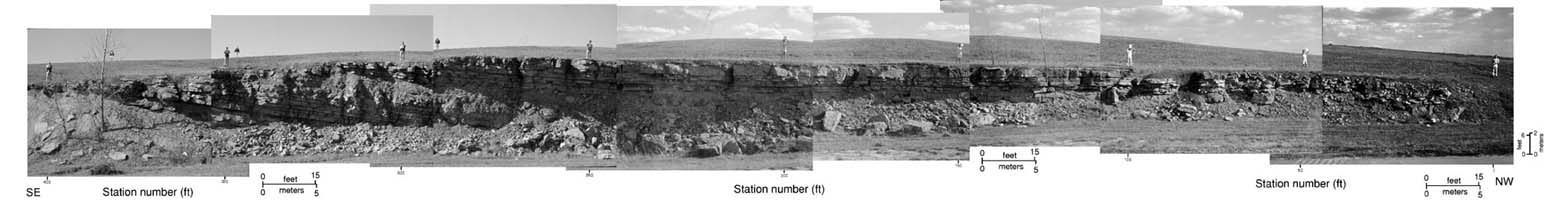
Fig. 9B--Interpreted photomosaic of the Plattsburg Limestone study site. Reflections seen on both GPR data and the outcrop are indicated by dashed lines. ML1-6 and BS1-2 refer to bedding units within the Merriam Limestone Member and Bonner Springs Shale, respectively. For enlarged view, click on section of image.
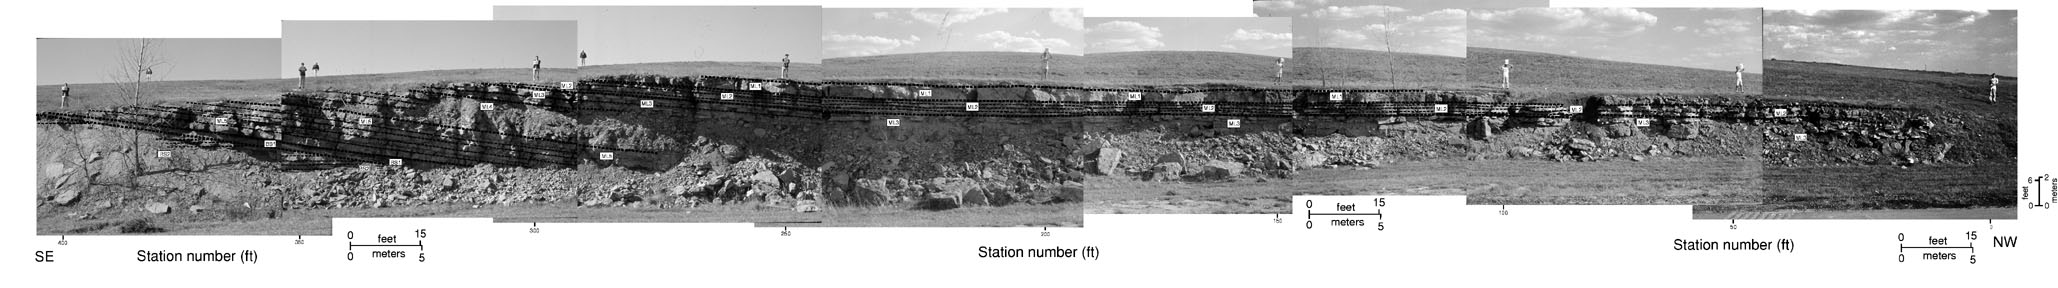
Fig. 10A--Uninterpreted GPR profile from the Plattsburg Limestone study site. The GPR data have a vertical scale of two-way time in nanoseconds and a trace spacing of approximately 3 cm. For enlarged view, click on section of image.
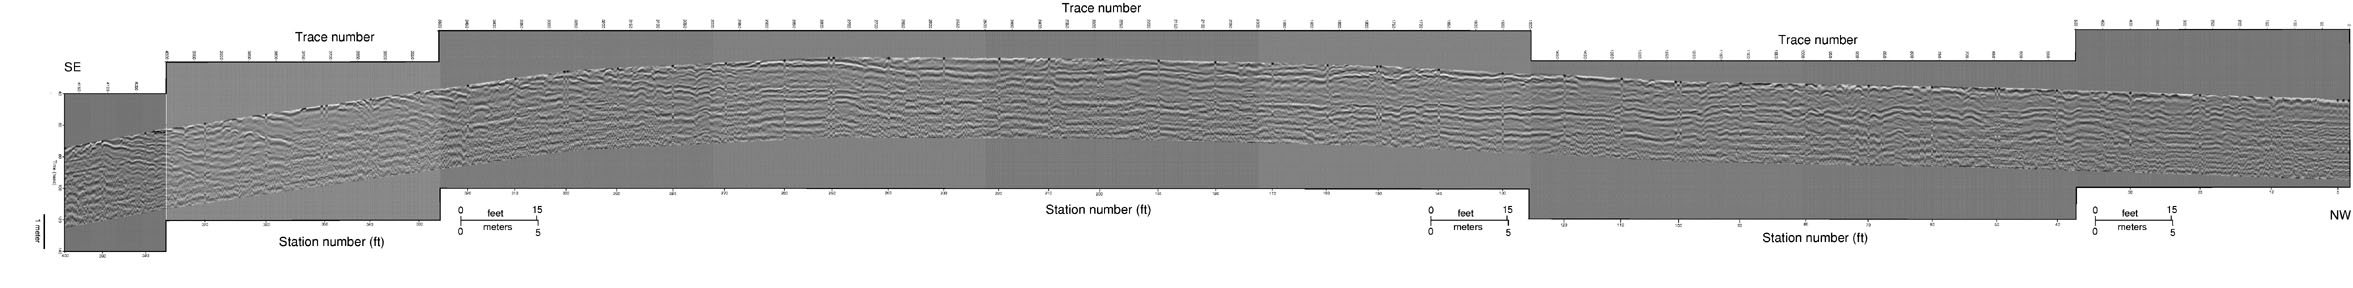
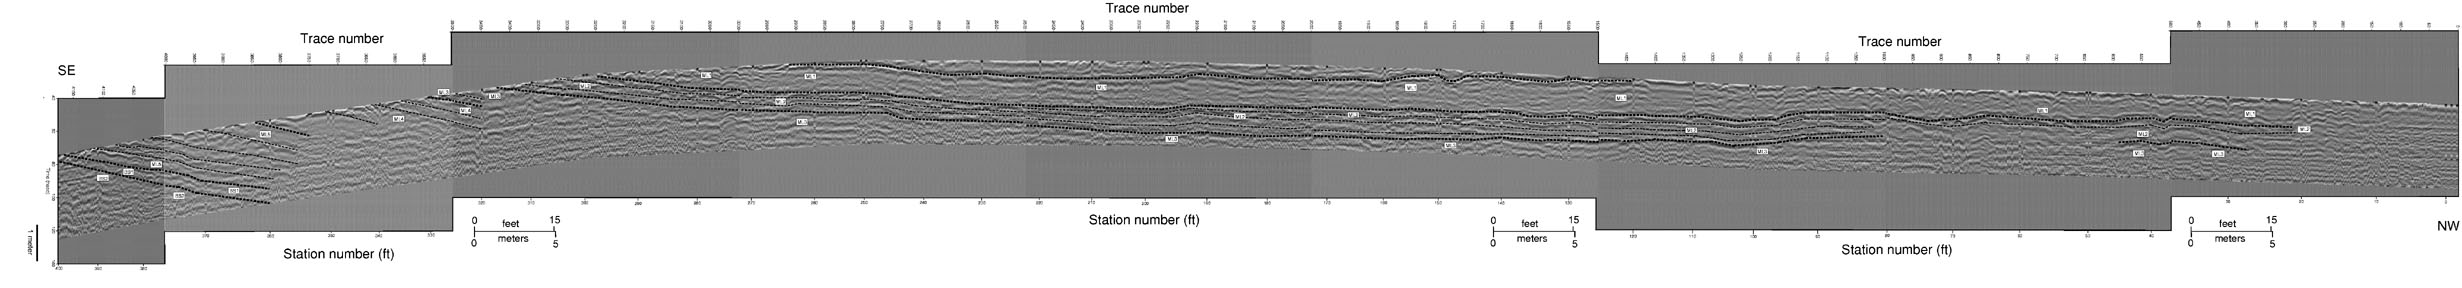
Fig. 10B--Interpreted GPR profile from the Plattsburg Limestone study site. Reflections seen on both the GPR data and the outcrop are indicated by dashed lines. The GPR data have a vertical scale of two-way time in nanoseconds and a trace spacing of approximately 3 cm. ML1-6 and BS1-2 refer to bedding units within the Merriam Limestone Member and Bonner Springs Shale, respectively.
Although data were collected along the entire 366-m (1,200-ft) pathway, only the data acquired between stations 0 and 400 (fig. 7) were visible. Based on outcrop observations, the lack of reflectivity in the remainder of the data was probably due to signal attenuation caused by a combination of thicker soil cover, conductive shale, a high content of conductive clays in the Bonner Springs sandstones and siltstones, and lack of significant dielectric-constant and lithologic contrasts in the underlying rock units. The boundaries between the major stratigraphic units were the locations of the most significant dielectric-constant contrasts. The internal contrasts were minor in comparison.
High-amplitude GPR reflections that were correlated with major unit boundaries on the outcrop are indicated by heavy dashed lines on figs. 9 and 10. These reflections divide the Merriam Limestone Member into five major reflective packages or units (ML1-ML5). Reflections within the major packages are identified by thin dashed lines (figs. 9 and 10) and were correlated with bedding planes visible on the outcrop. A transition from limestone to shaly limestone to limestone beds is observed in the Merriam member between stations 0 and 400 (fig. 9). This transition was also indicated by changes in the internal reflectivity of packages ML1-ML5 (fig. 10). Units ML1, ML2, and ML5 appear to represent the limestone beds, while units ML 3 and ML4 represent shaly limestone beds (fig. 9). All of these units are generally flat-lying between stations 0 and 280 but were readily discernable from system noise on GPR data because they had slight variations in travel times and were not truly horizontal. The dips of beds increased between stations 280 and 400 as the margin of a series of hemi-channels was approached. This dip was mostly primary because the beds were deposited along the flanks of a channel. Primary dip was also indicated by flatter dips of overlying and underlying strata in some cases. However, the primary dip may have been partially exaggerated due to some compaction of underlying, finer-grained clastic units.
Merriam Limestone Member (ML1)--Unit ML1 is a distinct limestone bed directly beneath the modern land surface. The top of this bed was traceable between stations 120 and 265, whereas the base was imaged between stations 20 and 300 (figs. 9 and 10). Both the upper and lower contacts of this approximately 1.0-m (3.3-ft)-thick bed were imaged by GPR as relatively high amplitude reflections along most of its lateral extent. The large reflection amplitude of the top of ML1 might indicate that it is the contact between the Merriam Limestone Member and overlying Hickory Creek Shale Member. It is also possible that the reflection represents the base of a thicker soil layer, potentially a residual from the Hickory Creek. The low velocity of the overlying material was indicated by the slight velocity pull-down between stations 145 and 250 (fig. 10). Internal GPR reflections were of lower amplitude than those of stratigraphically lower limestone units. The reflection character of ML1 was likely due to its massive bedding and homogeneous limestone lithology, resulting in relatively small dielectric-constant contrasts internally.
Merriam Limestone Member (ML2)--Unit ML2 is a competent limestone that can be traced from stations 20 to 315 (fig. 9). Large-amplitude reflections within this unit (fig. 10) were probably due to argillaceous material between the limestone beds or compaction differences at bed boundaries. Gradual thickening and thinning of beds within unit ML2 was indicated on both the photomosaic (fig. 9) and the GPR data (fig. 10). The termination of the uppermost internal reflection near the top of unit ML2 between stations 220 and 230 (fig. 10) correlated with the thinning of a bed between this reflection and the top of ML2, which was consistent with outcrop observations. This reflection was characterized by a high-amplitude trough (white) with high-amplitude adjacent peaks (dark gray) along most of its length between stations 20 and 170. The relative strength of this reflection was gradually reduced between stations 170 and 190 due to a lessening of dielectric-constant contrasts. Beyond station 190 the reflection varied between a single event and a doublet as it interfered with the reflection associated with the top of ML2. This reflection ended between stations 220 and 230, as the bed became too thin to image with the 500-MHz GPR antenna.
Prev Page--Plattsburg Limestone || Next Page--Plattsburg Limestone, cont.
Kansas Geological Survey
Web version September 15 1998
http://www.kgs.ku.edu/Current/1998/martinez/martinez7.html
Comments to webadmin@kgs.ku.edu