Preliminary Analysis of Projected
Water Demands
R. W. Buddemeier and B. B. Wilson
Contents
-
Introduction
-
Methods
-
Rate of Demand Increase, PWS Groups
-
Year of Projected Shortfall, PWS
Groups
-
Volume of Projected Shortfall, PWS
Groups
-
Composite Risk Index (Rate, Year,
Volume), PWS Groups
-
Composite Risk Index (Rate, Year,
Group), Aggregated at County Level
-
SW Kansas: A Special Circumstance
-
Primary and Secondary Suppliers
-
-
-
Introduction
-
-
Risks associated with inadequate water supplies and unmet
demands include:
1. Increased costs, limits on economic development
2. Local and regional competition for limited
supplies
-
3. Dependence on marginal supplies decreases reliability,
increases vulnerability
-
4. Diminished quality of life
Among the contractual objectives of the High Plains Aquifer Evaluation
Project is technical support to KWO in meeting the Legislature's mandate
to the KWA to provide recommendations "...related to the potential for
competing water needs for at least the next 20 years and the means of addressing
the competition."
As a result of discussions with legislators and agency heads, this mandate
has been formulated in terms of evaluating the means by which projected
public water supply demands for additional water by the year 2020 might
be met. As this activity has not previously been undertaken, methods have
had to be developed. Since the topic is a complex one and the time and
resources available do not permit a detailed, across-the-board analysis
of all public water suppliers (close to 1,000 in the state), the strategy
adopted has been one of 'triage' -- a term originally used to describe
prioritization of care for casualties in warfare or disaster situations,
but more generally applied to dealing with a wide range of problems with
limited resources (see appendix for further
discussion of this approach).
Because of the emphasis on competition, the project has focused on identifying
the locations most likely to experience difficulty in meeting future demands
as a result of mismatch between demand and available resources. KWO public
water supply demand projections were used as the basis for the assessment.
The initial assessment is designed in three hierarchical stages:
1. Rank the absolute amounts and relative rates of demand change
in various geographic areas, and select criteria by which to make a first
identification of potential problem areas.
2. Review the classifications and refine with additional criteria as
appropriate -- water quality is an example of a consideration in obtaining
an adequate usable supply of water in some areas.
3. Assess the water potentially available in the identified areas from:
a. Lakes, impoundments, and reservoirs (KWO)
b. Streamflow and alluvial aquifers (KGS, KWO)
c. Groundwater (KGS).
Once complete, this initial assessment will have identified the areas most
likely to experience difficulty in obtaining adequate water in the future,
and will also provide an inventory of the candidate sources -- and the
competitors for their use -- in the same area. At this point, a more detailed
analysis can be undertaken to address possible resolution of the anticipated
problems.
Methods
The KWO projections tabulate demand for the years 2000, 2010, 2020, 2030,
and 2040 by each public water supply, broken down by county. Because the
defined boundaries are subject to change (e.g., by annexation, merger,
formation of new districts, etc.), and because there are extensive transfers
of water between suppliers, it is doubtful whether present-day maps of
the service regions and projected demands of the individual suppliers and
a 20-year analysis based on present distribution of supply would provide
a reliable planning basis. For these and other reasons, the initial assessments
are made primarily at the level of district 'groups' that are known to
be linked by contracts or transfer agreements. Additional analyses were
carried out at the county level as well as by individual district,
Analysis at a scale above that of the individual supply district has
a number of advantages and justifications:
-
It provides a manageable number of geographically related, well-defined
units;
-
The spatial scale of the larger groups and of counties is more comparable
to the aquifers and watersheds that are the natural hydrologic units than
are most individual supply districts;
-
At the county level, the geographic comparability of the units permits
visualization through mapping without the distortions imposed by extreme
demand density difference between urban and rural supply districts; and
-
The size of most supply groups (and most counties as well) is such that
the suppliers they contain will be within 35 miles of each other, and therefore
inside the limit imposed by the Water Transfer Act (making it reasonable
to consider them as a potentially interactive system).
The 2000, 2010, 2020, 2030, and 2040 projections for each supplier in a
group were summed to give a total, in thousands of gallons per year. The
net changes and percentage changes in demand were calculated for each group,
and the results tabulated and mapped in ArcView. Individual suppliers were
classified as primary (possessors of surface or groundwater rights or long-term
reservoir contracts) secondary (with no water rights, obtaining water through
primary suppliers). The supply and demand projections for the groups were
also apportioned at the county level.
Preliminary criteria were developed to conduct the triage. Three primary
factors and a secondary factor were considered. First, projected shortfalls
in supply (present supply minus projected demand) were analyzed, and ranked
by year. Because of the time required for both legal and engineering solutions
to problems to be implemented, near-term problems have a high level of
urgency. Second, it was judged that there was some absolute level of increase
that was sufficiently small to be unlikely to result in serious problems
unless the supply were already extremely marginal. An initial threshold
was established and the amount of demand shortfall was classified above
in steps above this level. The values selected can be easily changed if
review suggests better values. The third factor considered was the percentage
change. It is common experience that relatively straightforward conservation
measures can result in savings of 10% or more unless the community in question
has already been under heavy restrictions, and a 20 year time frame is
ample to allow for the institution of education, regulation, and pricing
programs to increase use efficiency. Increases of less than 10%, regardless
of absolute size, were not considered likely to be highly problematic.
Increases of 10-25% and >25% were ranked as increasingly serious.
The secondary factor considered is actually more appropriate to the
supply issues discussed elsewhere in this report, but was included here
to highlight a separate class of problems. This assessment implicitly assumes
that present supply is adequate and stable. This is not always the case;
in particular, substantial areas of the High Plains aquifer have projected
depletion times of less than 50 years, and the public supplies relying
on those resources have few alternatives to turn to. The problem is even
more serious for communities with growing demands in those areas where
the aquifer is administratively closed to further appropriations. Southwest
Kansas was used as a case study of these problems, and also serves to illustrate
the display issues involved in comparing districts, groups, and counties
of disparate size and demand density (see below).
Results
-
-
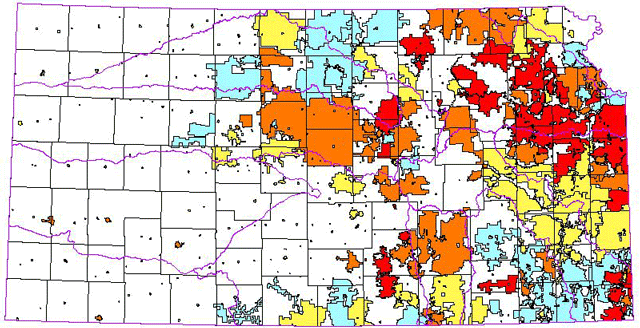
Rate of Demand Increase:
Assessed for all groups of water suppliers, whether or not they have water
rights or contracts adequate to meet projected demands. The Year 2020 is
used as a standard base for comparison.
| Figure 1:
Percent Increase in Demand, 2000 - 2020 |
 |
| 20 year growth (all documented suppliers) |
Risk Factors: Rate of Demand
Growth |
| |
< 0 % |
-
1. Rapid or extended growth may overtax infrastructure
2. Supply reliability may be lower at higher
delivery rates or volumes
3. Regional clusters of growth set the stage
for competition when some districts exceed their supply
-
4. Reduction of common reserves increases large-scale
vulnerability
|
| |
0 - 10 % |
| |
10 - 25 % |
| |
> 25 % |
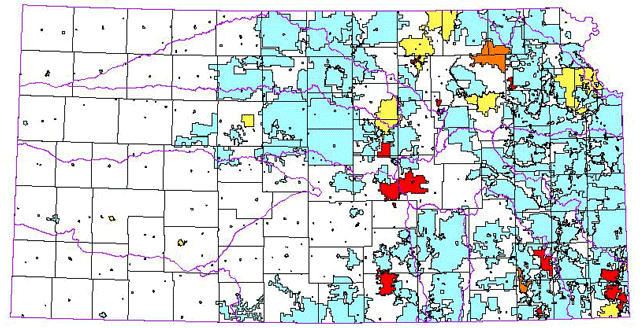
Year of projected shortfall:
Assessed for those districts whose demand will exceed present firm supply
by or before 2040.
| Figure 2:
Projected Time of Supply Shortfall |
 |
| shortfall year |
Risk Factors: Time of shortfall |
| |
> 2040 |
Rapid onset of problems:
1. Limits options for response
2. Promotes high-cost, short-term, 'band-aid'
solutions
3. Puts a premium on effective planning and
preparation |
| |
2021-2040 |
| |
2011-2020 |
| |
2000-2010 |
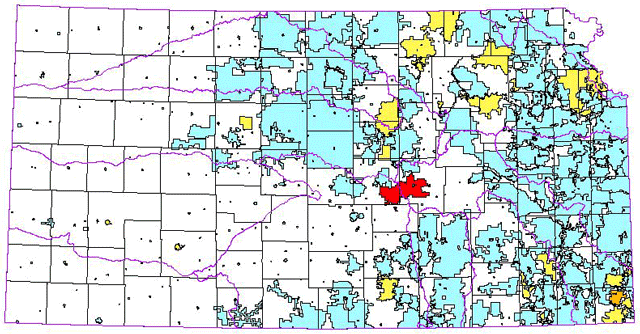
Volume of projected shortfall
for those groups with shortfalls in the year 2020. Use of 2040 shortfalls
would show more areas and larger numbers.
| Figure 3:
Projected Shortfall Volume, 2020 |
 |
| shortfall volume, 2020 (kgal/year) |
Risk Factors: Shortfall volume |
| |
< 0 (0) |
The following increase with
increasing volume of projected shortfall:
1. Resources at risk -- people, dollars.
2. Time required for correction
2. Cost of correction
3. Sensitivity to errors in estimates |
| |
0 - 25,000 (3) |
| |
25-50,000 (2) |
| |
> 50,000 (1) |
-
-
-
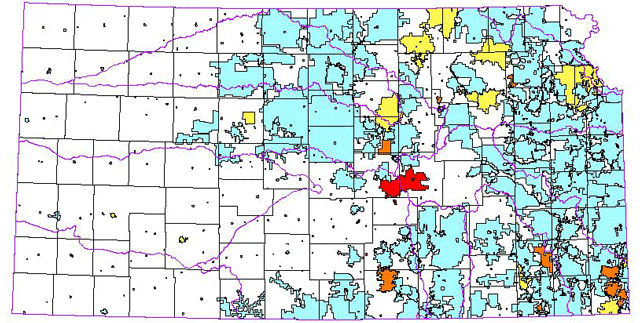
Composite Risk Score: Sum
of rankings in the year, rate and volume classes. For this application
the rate and volume classes were calculated on the year of shortfall, not
a standard time.
| Figure 4a:
Composite Risk Score (shortfall groups) -- Time, Volume, Rate |
 |
| score (sum of volume, percent and year) |
Risk Factors: |
| |
no shortfall through 2040 |
Risks and costs of correction
or mitigation are related to the magnitude of the problem, the time available
to deal with it, and the rates of change and uncertainties involved.
The simple sum of component scores is one example of a combined approach. |
| |
7-9 |
| |
5-6 |
| |
3-4 |
-
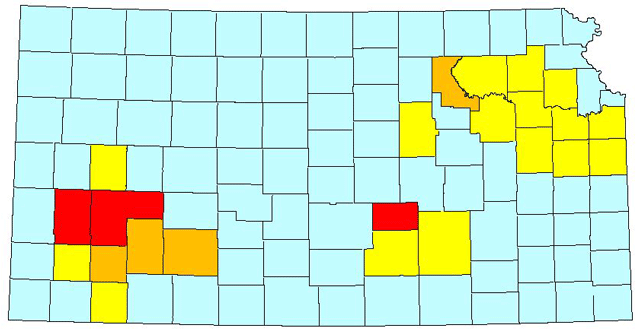
Composite Risk reallocated
at the county level -- calculations and scoring are similar to the Group
analysis, but class values were adjusted for the scale difference.
| Figure 4b:
Composite Risk Score (shortfall groups by county) -- Time, Volume, Rate |
 |
| score (sum of volume, percent and year) |
Note: |
| |
no shortfall through 2040 |
In order to provide comparable
displays at the different scale of the counties, scoring criteria were
adjusted as follows:
Percent Growth by 2040: same as PWS districts
Shortfall year: 2020 = 1, 2030 = 2, 2040 = 3
Shortfall volume: >200,000 kgal/yr = 1, 100,000 -
200,000 = 2; 0 - 100,000 = 3 |
| |
7-9 |
| |
5-6 |
| |
3-4 |
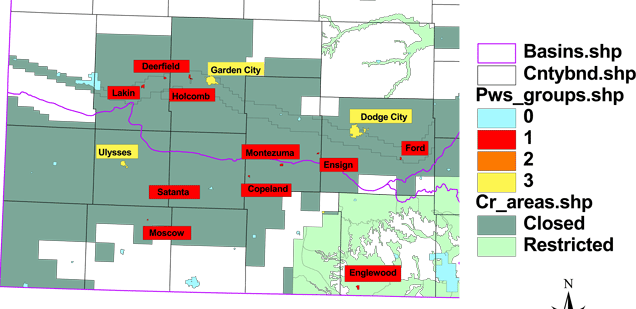
SW Kansas Municipalities
-- a special case study in isolation and resource access. Color coding
by year of shortfall.
| Figure 5a:
A Special Case -- SW Kansas Suppliers' Demand Projections |
 |
| shortfall year |
Special Risk Factors |
| |
> 2040 |
Identified districts:
1. Are mostly in areas closed to appropriation;
2. Are isolated;
3. Depend on a resource that is depleting;
4. In many cases, are on the margin of the aquifer;
5. Lack supply alternatives. |
| |
2021-2040 |
| |
2011-2020 |
| |
2000-2010 |
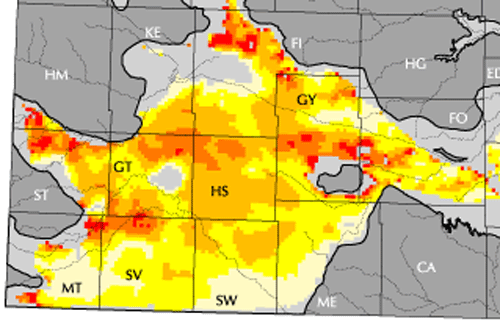
| Figure 5b:
A Special Case -- SW Kansas Groundwater Supplies |
  |
Primary water right holders
-- the Group supply does not reflect that of all its members.
| Figure 6: Primary and Secondary Water
Suppliers |
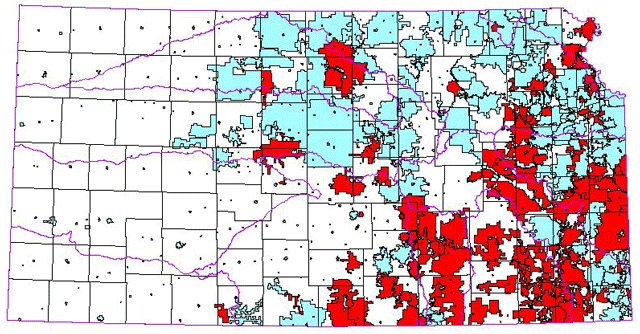 |
| Primary water right holders |
Risk Factors: Secondary suppliers |
| |
Possess some groundwater or surface
water rights or long-term reservoir contracts |
1. Planning and development
is effectively under the control of the primary supplier(s).
2. Competition and shortfalls may develop within supply
groups that have adequate total resources on paper. |
| |
No rights or independent contracts;
depend on purchase from primary suppliers |
| |
|
| |
|
Funded (in part) by the Kansas Water Plan Fund


