Kansas Geological Survey, Open-file Report 1999-8
Prev page--Garden City Site
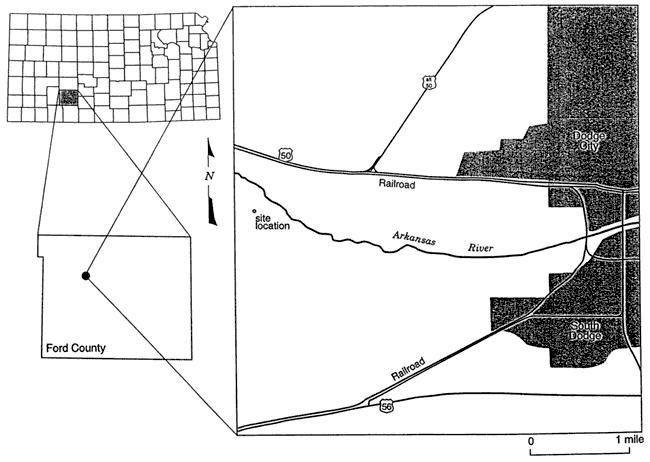
The Dodge City site is located in Ford County 1/4 mile south of the Arkansas River just west of Dodge City (Figure 46). The site consists of four wells screened over different vertical intervals in the alluvial and underlying High Plains aquifers. Table 5 provides well construction information for the site, while Table 6 provides the schedule and details of the slug tests performed at the site.
Figure 46--Location map for Dodge City monitoring site.

Table 5--Well construction information for wells at Dodge City monitoring site.
| Well No. | Borehole Radius (ft) |
Casing Radius (ESR)1 (ft) |
Total Depth2 (ft) |
NSI3 (ft) |
Grout Interval4 (ft) |
|---|---|---|---|---|---|
| DCOW-1 | 0.281 | 0.103 (0.281) |
167 5 | 155-165 | 0-145 145-150 |
| DCOW-2 | 0.281 | 0.103 (0.281) |
120 5 | 106-116 | 0-87 87-92 |
| DCOW-3 | 0.281 | 0.103 (0.281) |
76 5 | 68-74 | 0-51 51-56 |
| DCOW-4 | 0.281 | 0.103 (0.281) |
38 5 | 31-36 | 0-26 6 |
| 1--ESR or effective screen radius. In high-K formations, the effective screen radius may be closer to the nominal radius of the well screen (Butler, 1996). 2--depths are from top of casing in this and remaining columns 3--NSI = nominal screened interval 4--first range is for neat cement grout, second range is for bentonite pellets (Holeplug) 5--depth includes a sump at bottom of screen 6--only bentonite pellets used at this well |
|||||
Table 5--Schedule and details of slug tests performed at the Dodge City monitoring site
| Date | Test Well 1 |
Test No. |
H0* (ft) 2 |
%Rec 3 | H0/H0* 4 |
|---|---|---|---|---|---|
| 10/04/99 | DCOW-1 | 1 | 0.36 | 98.6 | 0.94 |
| 2 | 0.59 | 100.0 | 0.94 | ||
| 3 | 1.44 | 99.9 | 0.99 | ||
| 4 | 1.32 | 99.8 | 0.95 | ||
| 5 | 0.55 | 99.4 | 0.96 | ||
| 6 | 0.32 | 99.3 | 0.92 | ||
| 10/04/99 | DCOW-3 | 1 | 0.27 | 100.0 | 0.99 |
| 2 | 0.41 | 99.5 | 0.96 | ||
| 3 6 | 1.09 | 96.5 | 1.04 | ||
| 4 6 | 0.88 | 97.6 | 1.05 | ||
| 5 | 0.57 | 99.6 | 0.96 | ||
| 6 | 0.28 | 100.0 | 0.97 | ||
| 10/05/99 | DCOW-4 | 1 | 0.29 | 99.6 | 0.85 |
| 2 | 0.45 | 100.0 | 0.8 | ||
| 3 | 0.84 | 99.7 | 0.95 | ||
| 4 | 2.18 | 99.8 | 0.87 | ||
| 5 | 1.03 | 100.0 | 0.8 | ||
| 6 | 0.52 | 100.0 | 0.81 | ||
| 7 | 0.34 | 100.0 | 0.82 | ||
| 10/05/99 | DCOW-2 | 1 | 0.26 | 99.8 | 0.97 |
| 2 | 0.44 | 99.3 | 1.00 | ||
| 3 | 0.86 | 99.2 | 0.96 | ||
| 4 | 0.81 | 99.9 | 0.98 | ||
| 5 | 0.45 | 99.0 | 1.00 | ||
| 6 | 0.28 | 100.0 | 0.97 | ||
|
1--wells listed in order in which tests were performed 2--expected H0 measured by air-pressure transducer 3--percent recovery--relative measure of how close well had returned to static conditions prior to test initiation--one minus ratio of distance from static at time of test initiation over H0 (both based on water-pressure transducer readings) times 100 4--H0 measured at time of test initiation with water-pressure transducer over H0*--values greater than approximately 1.05 are a product of sensor noise and the methodology used to estimate H0 from the water-pressure transducer readings, while values less than about 0.95 may be an indication of a test initiation that was non-instantaneous relative to the formation response or water-pressure transducer readings that need to be adjusted for dynamic pressure effects 5--test inadvertently not run to completion 6--small air leak somewhere in well and well-head apparatus affected H0 reading |
|||||
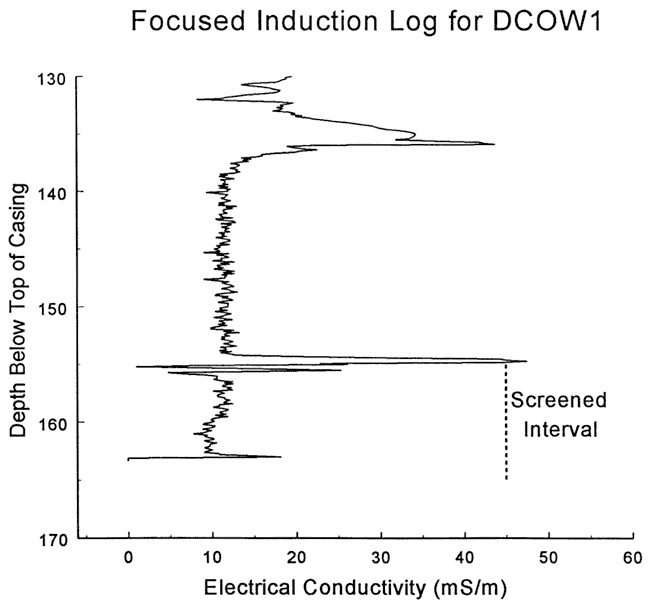
Six slug tests were performed at well DCOW-1 on October 4, 1999. Figure 47 is a plot of normalized head versus time for this series of tests. As shown in the figure, response data from all six tests are oscillatory in nature. Although the response data for tests initiated with a large H0 appear to be very slightly damped with respect to data from the other tests, this slight dependence on H0 is not of practical significance. Thus, the influence of nonlinear mechanisms can be ignored for these tests. The near-coincidence of the response plots indicates that dynamic skin effects are also quite small. Test two was selected for analysis because it coincided with tests one, five, and six, but had less noise. Figure 48 displays the focused induction log in the vicinity of the test interval (no logging data available below screened interval).
Figure 47--Normalized head (H(t)/H0) versus the logarithm of time since test initiation for series of slug tests performed at well DCOW-1.
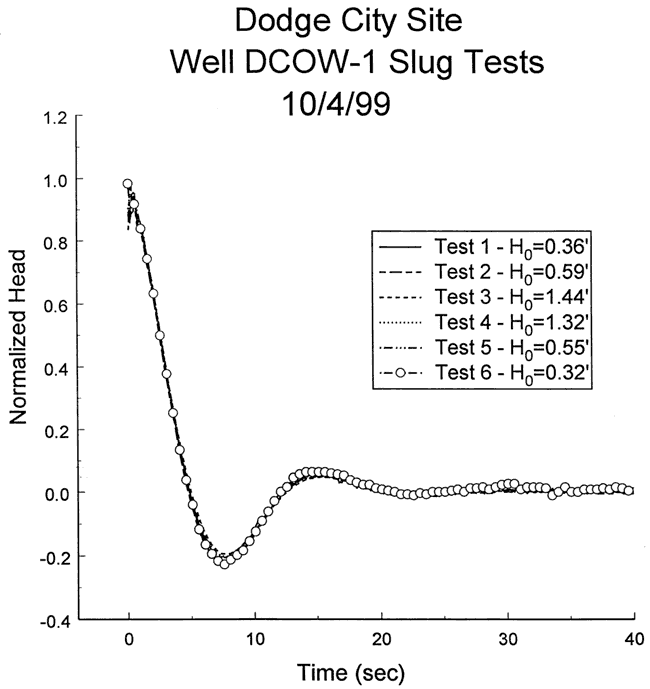
Figure 48--Focused induction log at well DCOW-1 for portions of the formation in the vicinity of the screened interval (spike at top of screened interval produced by casing centralizer).
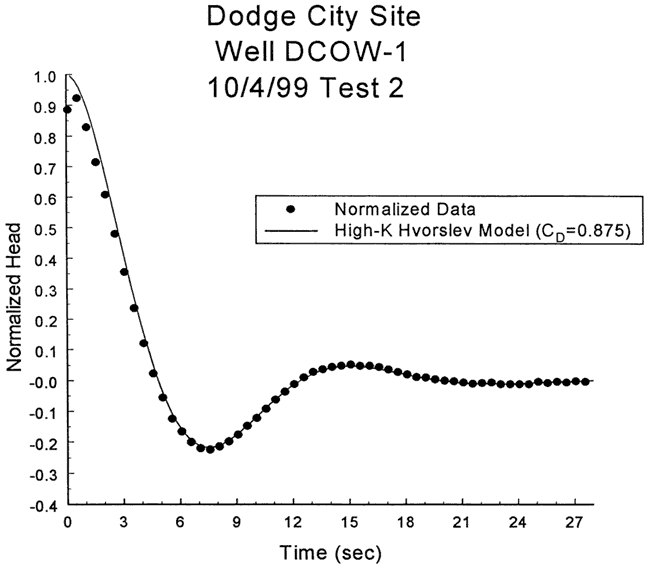
Given the oscillatory nature of the response data, test two was analyzed with the high-K variant of the Hvorslev model. Figure 49 is a plot of the normalized data and a theoretical type curve (CD = 0.875, Le = 147.8 ft) from the high-K Hvorslev model. As shown in the figure, there is a close match between the type curve and the response data. The small differences at early times are most probably a function of dynamic pressure effects. As discussed earlier, the high-K Hvorslev model has two variants: 1) top and bottom impermeable boundaries do not influence test responses (equation (8.9c) of Butler (1997)); and 2) well screened up against an impermeable boundary (equation (8.9c) of Butler (1997) with (1/ψ) replacing (1/(2ψ)). Although not shown in the log of Figure 48, DCOW-1 is screened up against a siltstone bedrock. Thus, the second variant of the high-K Hvorslev model was used here. Substituting a CD value of 0.875, an effective column length (Le) of 147.8 ft, and the well construction parameters of Table 5 into the modified form of equation (8.9c) of Butler (1997) produces a K estimate of 104 ft/day, a value that is quite reasonable for a test interval consisting of sand and gravel. Note that the effective column length of 147.8 ft is within 0.6 ft (<1%) of what would be expected from the depth to water measurement and the well construction information, lending further credence to the analysis results.
Figure 49--Normalized head (H(t)/H0) versus log time plot for test 2 at DCOW-1 and a theoretical type curve from the high-K Hvorslev model.
As noted in Table 5, there is some question about the effective screen radius for tests in high-K intervals, which translates into uncertainty in the K estimate. The K estimate of 104 ft/day was obtained assuming that the effective screen radius was equal to the borehole radius. Since the hydraulic conductivity of the filter pack is probably not much greater than that of the formation, the nominal outer radius of the well screen might be a more appropriate quantity for the effective screen radius. In that case, a K estimate of 125 ft/day is obtained. Thus, the K estimate is between 104 and 125 ft/day, and most likely lies near the upper end of that range.
Six slug tests were performed at well DCOW-3 on October 4, 1999. Figure 50 is a plot of normalized head versus logarithm of time for this series of tests. As shown in the figure, response data from the six tests were in reasonable agreement. Test one was not run to completion, so the head value used for static conditions was only an estimate. Tests three and four were affected by small air leaks in the pneumatic wellhead apparatus, so there is some uncertainty about whether static conditions had been achieved prior to depressurization. When the three tests (two, five, and six) that did not have any apparent problems are considered, the response data essentially coincide, indicating that nonlinear mechanisms and dynamic skin effects can be neglected at this well. Test five was chosen for analysis because the larger H0 produced a lower degree of noise in the normalized data. Figure 51 displays the focused induction log in the vicinity of the test interval.
Figure 50--Normalized head (H(t)/H0) versus the logarithm of time since test initiation for series of slug tests performed at well DCOW-1.
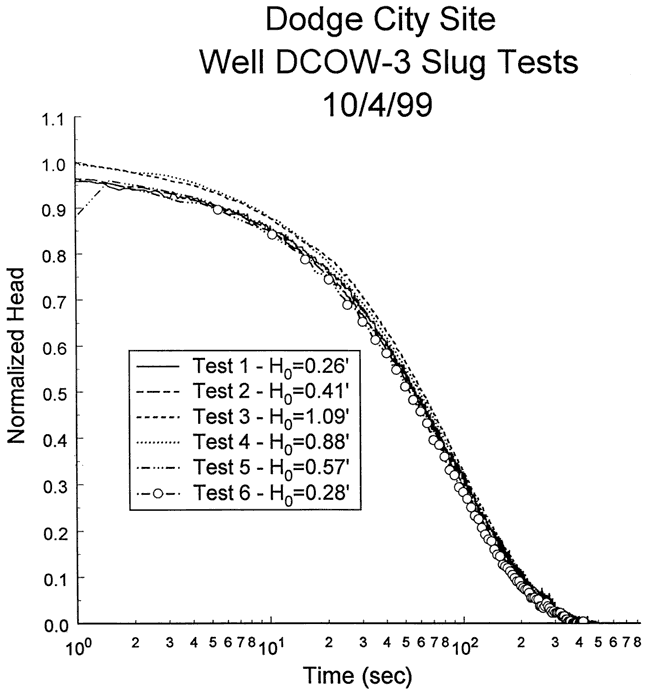
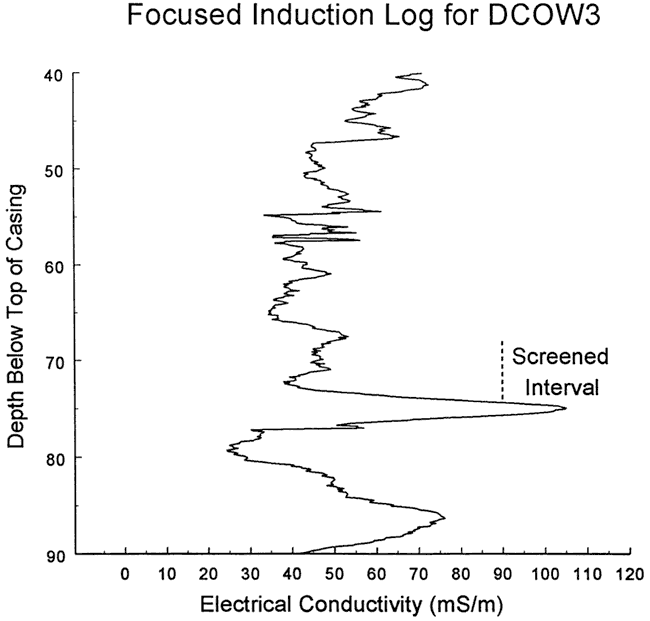
Figure 51--Focused induction log at well DCOW-1 for portions of the formation in the vicinity of the screened interval at DCOW-3.
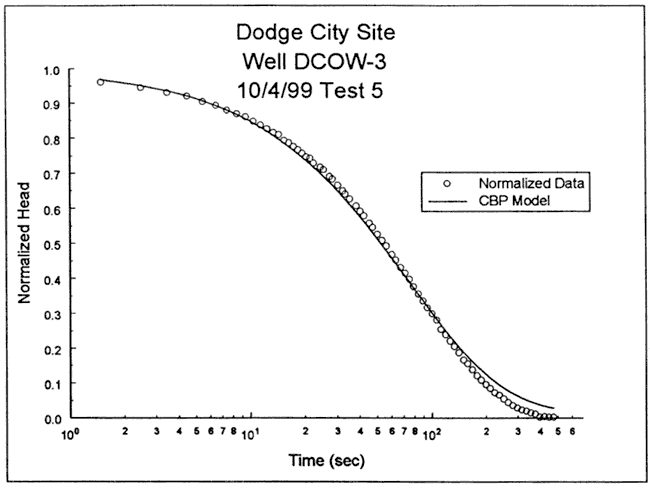
The response data were initially analyzed with the fully penetrating well model of Cooper et al. Figure 52 is a plot of the normalized data and the Cooper et al. type curve for a specific storage value at the lower end of the range of physical plausibility (Ss = 2.2x10⁻⁶ ft-1). In this case, a reasonable match could not be obtained with the Cooper et al. model using any value for specific storage. The nature of the systematic deviation shown on Figure 52 is different from the deviations associated with a low-conductivity well skin or a significant component of vertical flow, so some other mechanism must be an important control on the response data at this well.
Figure 52--Normalized head (H(t)/H0) versus log time plot for test 5 at DCOW-3 and the best-fit Cooper et al. type curve (Ss equals 2.2x10⁻⁶ ft-1).
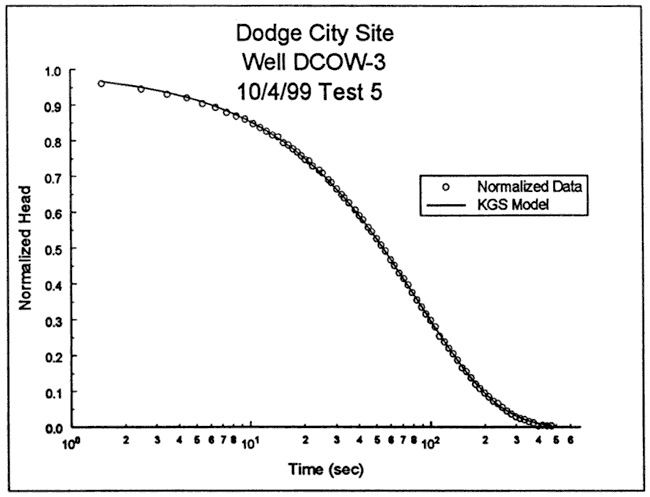
The focused induction log of Figure 51 shows that DCOW-3 is screened in material of moderately high electrical conductivity. A short distance above the screened interval, there is a zone of lower electrical conductivity (and smaller natural gamma values). If this zone is assumed to be considerably more permeable than the test interval, it would act as a constant-head boundary for tests at DCOW-3. The response data were therefore analyzed with the KGS model for partially penetrating wells, assuming a layer thickness of 10 ft (impermeable unit at base of screen) and a constant head boundary four ft above the top of the screen. Figure 53 is a plot of the normalized data and the best-fit KGS model type curve (K = 2.8 ft/day, Ss = 2.8x10⁻⁵ ft-1). In this case, a very good match can be obtained using a physically plausible value of specific storage.
Figure 53--Normalized head (H(t)/H0) versus log time plot for test 5 at DCOW-3 and the best-fit KGS model type curve (Ss equals 2.8x10⁻⁵ ft-1).
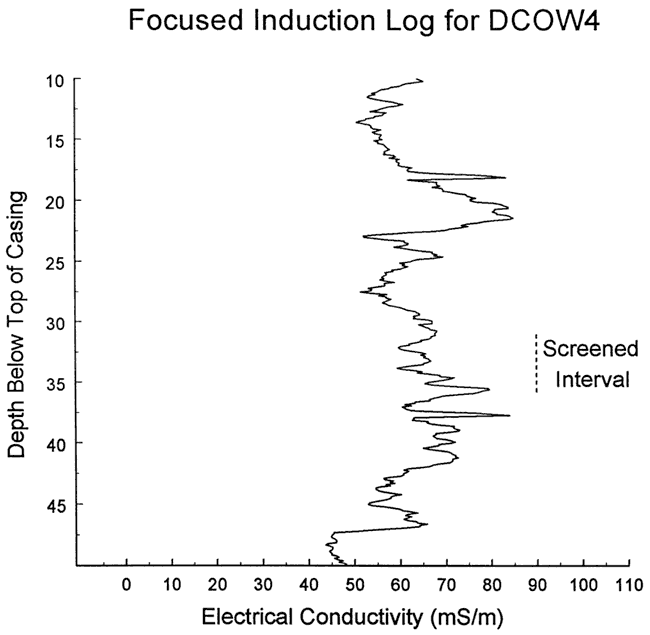
Seven slug tests were performed at well DCOW-4 on October 5, 1999. Figure 54 is a plot of normalized head versus logarithm of time for this series of tests. Although the first three tests coincide, indicating the influence of nonlinear mechanisms is small, the larger H0 of test four apparently initiated further well development. Tests six and seven approximately coincide, indicating that dynamic skin effects were not significant for those tests. Test six was selected for analysis because the larger H0 produced a lower degree of noise in the normalized head data. Figure 55 displays the focused induction log in the vicinity of the test interval.
Figure 54--Normalized head (H(t)/H0) versus the logarithm of time since test initiation for series of slug tests performed at well DCOW-4.
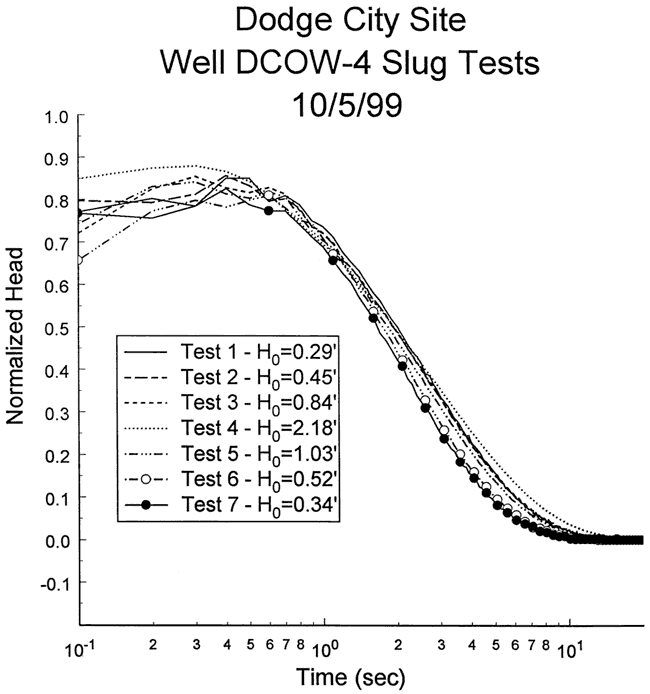
Figure 55--Focused induction log at well DCOW-1 for portions of the formation in the vicinity of the screened interval at DCOW-4.
A log normalized head versus time plot of test six (Figure 56) displays a concave-downward curvature, an indication that response data lie outside the overdamped regime assumed for the Cooper et al. and KGS models (Butler, 1997). The response data were therefore analyzed with the high-K variant of the Hvorslev model. Figure 57 is a plot of the normalized data and a theoretical type curve (CD = 3. 0, Le = 18. 1 ft) from the high-K Hvorslev model. There is a close match except at early time where the type curve significantly overpredicts test data. This difference was considered to be a product of dynamic pressure effects, so the type curve values were corrected for these effects. Figure 58 is a plot of the normalized response data and the corrected theoretical type curve. Although a much better fit is obtained, the early-time peak of the type curve is still above that of the response data. In addition, the Le value of 18.1 is significantly below the value of 21.5 ft expected from the depth to water measurement and the well construction information. The analysis was therefore repeated in an attempt to better match the early-time peak and the nominal Le value. Figure 59 is a plot of the normalized response data and the corrected type curve for CD = 2.5 (Le = 24.6 ft) . Although there is a systematic deviation between the response data and the type curve, little significance is attributed to this deviation because it could readily be explained by a non-negligible specific storage. Given the curve fits and the Le values, the CD = 2.5 and 3.0 type curves effectively serve as bounds on the response data.
Figure 56--Log normalized head (H(t)/H0) versus time for test 6 at DCOW-4.
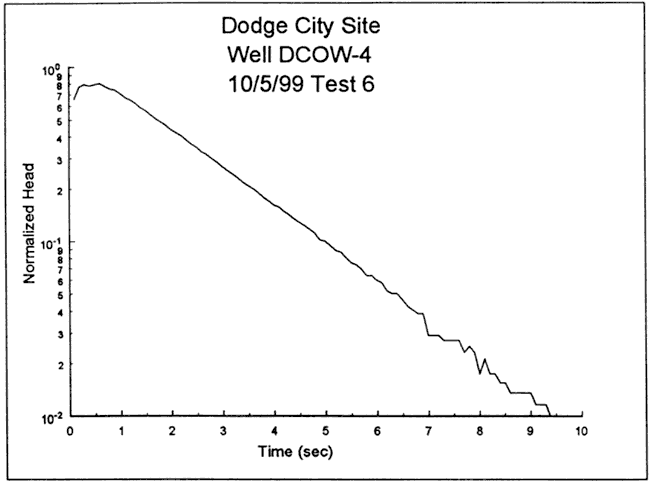
Figure 57--Normalized head (H(t)/H0) versus time plot for test 6 at DCOW-4 and a theoretical type curve from the high-K Hvorslev model.
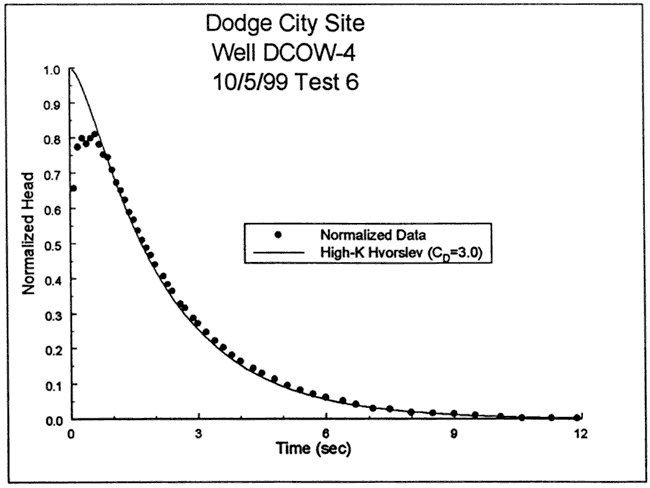
Figure 58--Normalized head (H(t)/H0) versus time plot for test 6 at DCOW-4 and a theoretical type curve from the high-K Hvorslev model corrected for dynamic pressure effects.
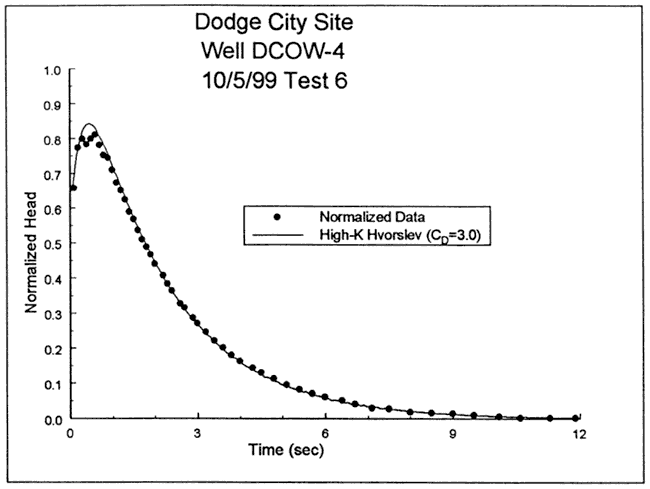
Figure 59--Normalized head (H(t)/H0) versus time plot for test 6 at DCOW-4 and a theoretical type curve from the high-K Hvorslev model corrected for dynamic pressure effects.
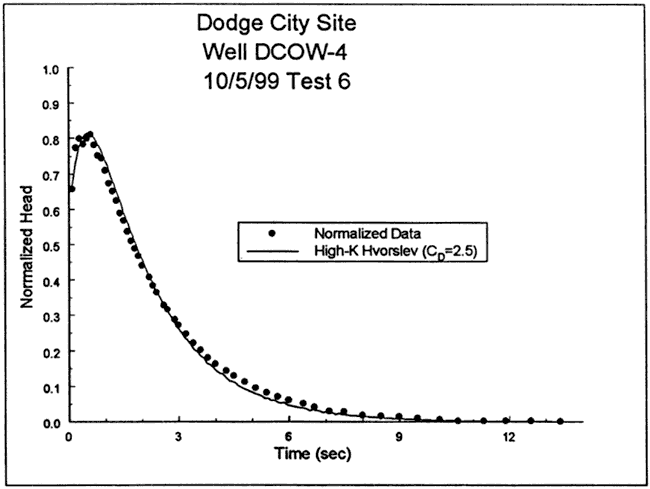
Hydraulic conductivity estimates were obtained by substituting the CD and Le estimates, and the well construction parameters of Table 5 into equation (8.9c) of Butler (1997). As noted in Table 5, there is some question about the effective screen radius for tests in high-K intervals, introducing uncertainty into the K estimate. If the borehole radius is used, a K estimate of 121 ft/day is obtained for the analysis of Figure 59. Since the hydraulic conductivity of the filter pack is probably not much greater than that of the formation, the nominal outer radius of the well screen might be more appropriate. In that case, a K estimate of 157 ft/day is obtained. Thus, the K estimate is between 121 and 157 ft/day, and most likely lies near the upper end of that range. Note that the difference in CD values between Figures 58 and 59 translates into a difference of less than 4% in the K estimate.
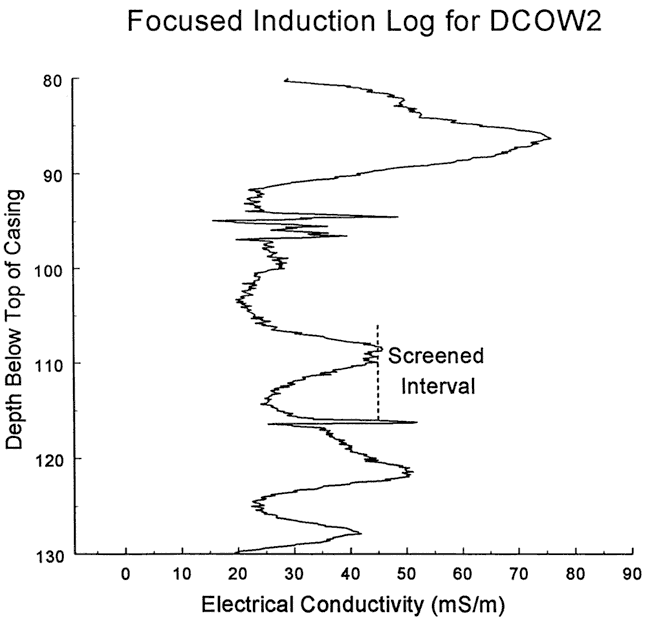
Six slug tests were performed at well DCOW-2 on October 5, 1999. Figure 60 is a plot of normalized head versus logarithm of time for this series of tests. As shown in the figure, response data from the first three tests lag those of the final three, an indication that there was a small degree of well development during the course of the test program. Tests five and six essentially coincide, indicating nonlinear mechanisms and dynamic skin effects can be ignored. Test five was selected for analysis because the larger H0 produced a lower degree of noise in the normalized head data. Figure 61 displays the focused induction log in the vicinity of the test interval.
Figure 60--Normalized head (H(t)/H0) versus the logarithm of time since test initiation for series of slug tests performed at well DCOW-2.
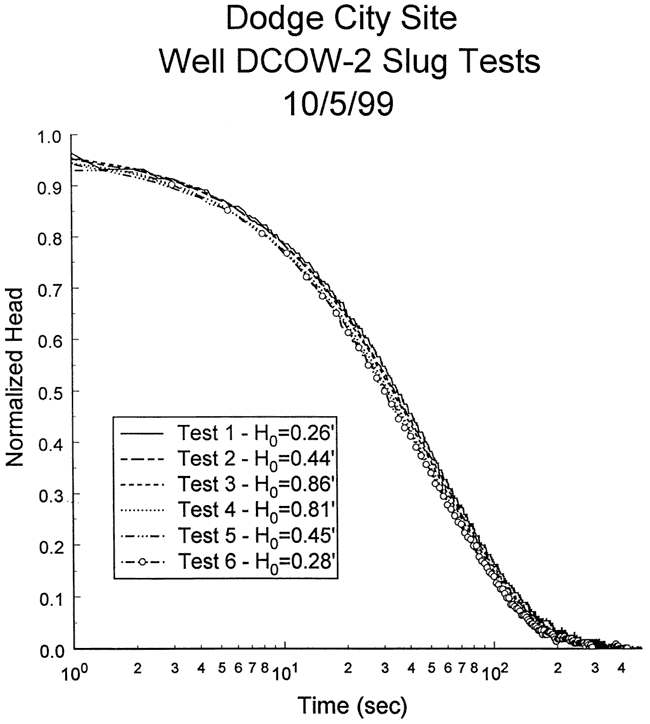
Figure 61--Focused induction log at well DCOW-1 for portions of the formation in the vicinity of the screened interval at DCOW-2.
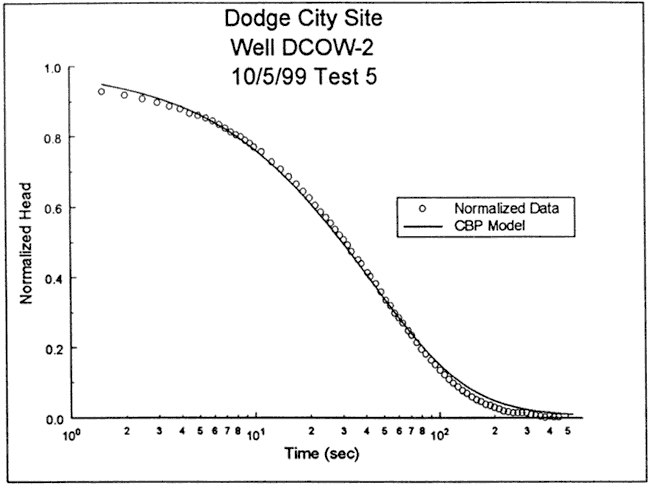
The response data were initially analyzed with the fully penetrating well model of Cooper et al. Figure 62 is a plot of the normalized data and the best-fit Cooper et al. type curve for a specific storage value at the lower end of the range of physical plausibility (Ss = 1.3x10⁻⁶ ft-1) In this case, a reasonable match could not be obtained with a physically plausible value of specific storage. The failure to obtain an acceptable match within the range of physical plausibility was most likely due to a significant component of vertical flow.
Figure 62--Normalized head (H(t)/H0) versus log time plot for test 5 at DCOW-2 and the best-fit Cooper et al. type curve (Ss equals 1.3x10⁻⁶ ft-1).
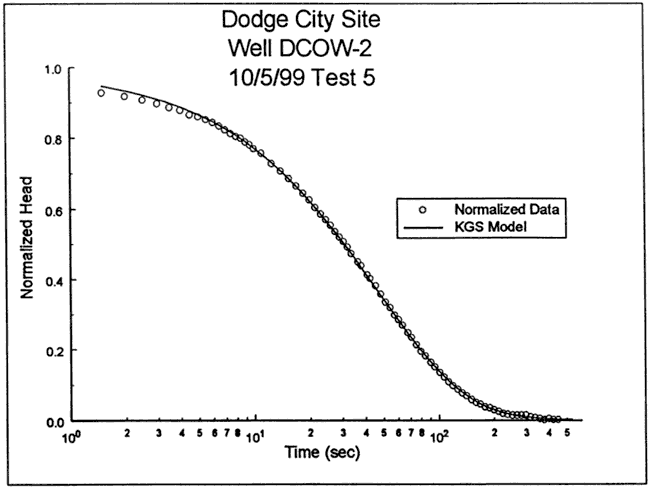
The response data were next analyzed with the KGS model for slug tests in partially penetrating wells (top of screen 17 ft below impermeable unit, layer thickness ≥ 40 ft). Figure 63 is a plot of the normalized data and the best-fit KGS model type curve (K = 2.9 ft/day, Ss = 2.1x10⁻⁵ ft-1) . In this case, a very good match was obtained using a physically plausible value of specific storage. The deviation seen at early times is most likely a product of error introduced during the selection of a start time for the test. Slug tests at well DCOW-2 were conducted using a data acquisition rate of 2 Hz (two measurements per second), so the start time could be in error by up to 0.5 seconds. The most conservative possible approach was used to select the start time in order to ensure that the test could not have started any later. Use of a start time 0.3 seconds earlier produces a much better fit at early times with no change at later times. Note that these data were also analyzed with the Hvorslev model using the normalized head range (0.15-0.25) recommended by Butler (1997). The resulting K estimate was within 4% of that obtained using the KGS model.
Figure 63--Normalized head (H(t)/H0) versus log time plot for test 5 at DCOW-2 and the best-fit KGS model type curve (Ss equals 2.1x10⁻⁵ ft-1).
A series of slug tests were performed by the Kansas Geological Survey in fourteen wells at three monitoring sites in Kearny, Finney, and Ford counties in southwest Kansas in June of 1998 and October of 1999. The primary purpose of these tests was to gain better knowledge of the hydraulic properties of the unconsolidated deposits that serve as the primary aquifers in the area. Table 7 provides a summary of the results of the test program. In all cases, the hydraulic conductivity estimates appear reasonable for an unconsolidated sequence of interbedded clay- through gravel-sized sediments. As emphasized by Butler (1997), hydraulic conductivity estimates obtained from slug tests should always be viewed as lower bounds on the average hydraulic conductivity of the formation in the vicinity of the test interval. As noted on Table 7, the uncertainty regarding the hydraulic conductivity estimates should not exceed a factor of two for most of the tests described in this report. If a range was reported for K in the report, the midpoint of that range is given in Table 7.
Table 7--Results of June 1998 and October 1999 slug test program.
| Test Well | Analyzed Test | Hydraulic Conductivity (ft/day) |
Uncertainty range1 |
|---|---|---|---|
| DOW-1 | Test Four | 15. | A |
| DOW-2 | Test One | 18. | A |
| DOW-3 | Test Four | 23, 8.7 2 | B |
| DOW-4 | Test Four | 72 | A |
| DOW-5 | Test Four | 139 | A |
| GCOW-1 | Test Four | 140 | A |
| GCOW-2 | Test One | 23 | B |
| GCOW-3 | Test Four | 4.9 | A |
| GCOW-4 | Test Four | 58 | A |
| GCOW-5 | Test Four | 8.1 | B |
| DCOW-1 | Test Two | 114 | A |
| DCOW-2 | Test Five | 2.9 | A |
| DCOW-3 | Test Five | 2.8 | A |
| DCOW-4 | Test Six | 139 | A |
|
1--A = K estimate should be within a factor of two of the average K of the formation in the vicinity of the test interval; B = considerable uncertainty in K estimate, estimate should be viewed as an approximate lower bound on the average K of the formation in the vicinity of the test interval 2--test was analyzed using a two-zone model |
|||
Bouwer, H., and Rice, R.C., 1976, A slug test for determining hydraulic conductivity of unconfined aquifers with completely or partially penetrating wells: Water Resources Research, v. 12, no. 3, pp. 423-428.
Butler, J.J., Jr., 1996, Slug tests in site characterization: Some practical considerations: Environmental Geosciences, v. 3, no. 2, pp. 154-163.
Butler, J.J., Jr., 1997, The Design, Performance, and Analysis of Slug Tests: Lewis Pub., Boca Raton, 252 pp.
Butler, J.J., Jr., and Healey, J.M., 1998, Relationship between pumping-test and slug-test parameters: Scale effect or artifact?: Ground Water, v. 36, no. 2, pp. 305-313.
Butler, J.J., Jr., and Healey, J.M., 1999, Improving the Performance and Analysis of Slug Tests: Midwest Geosciences Group Workshop at the Univ. of Wisconsin, 131 pp., 1999.
Butler, J.J., Jr., McElwee, C.D., and Liu, W.Z., 1996, Improving the quality of parameter estimates obtained from slug tests: Ground Water, v. 34, no. 3, pp. 480-490.
Cooper, H.H., Bredehoeft, J.D., and Papadopulos, I.S., 1967, Response of a finite-diameter well to an instantaneous charge of water: Water Resources Research, v. 3, no. 1, pp. 263-269.
Environmental Simulations, Inc., 1999, Guide to Using Aquiferwin32 Version 2.0.
Fetter, C.W., 1994, Applied Hydrogeology: Macmillan, New York, 691 pp.
Hvorslev, M. J., 1951, Time lag and soil permeability in ground-water observations: U.S. Army Corps of Engrs., Waterways Exper. Sta., Bull no. 36, 50 pp.
Hyder, Z., Butler, J.J., Jr., McElwee, C.D., and Liu, W.Z., 1994, Slug tests in partially penetrating wells: Water Resources Research, v. 30, no. 11, pp. 2945-2957.
MathSoft, Inc., 1997, Mathcad 7.0 User's Guide, 684 pp.
McElwee, C.D., Bohling, G.C., and Butler, J.J., Jr., 1995, Sensitivity analysis of slug tests I: The slugged well: Journal of Hydrology, v. 164, pp. 53-67.
McElwee, C.D., and Zenner, M.A., 1998, A nonlinear model for analysis of slug-test data: Water Resources Research, v. 34, no. 1, pp. 55-66.
McLane, G. A., Harrity, D. A., and Thomsen, K. O., 1990, A pneumatic method for conducting rising and falling head tests in highly permeable aquifers: Proc. of 1990 NWWA Outdoor Action Conf., National Water Well Assoc.
Weast, R.C. (ed.), 1976, CRC Handbook of Chemistry and Physics: CRC Press, Cleveland, OH, pp. D252-D253.
Whittemore, D.O., Tsou, M.-S., Young, D.P., and Healey, J.M., 1999, The upper Arkansas River corridor study: An update, Hydrogram, Kansas Water Office, Topeka, Ks, Spring issue, pp. 17-20.
Zurbuchen, B., 1999, 12/9/99 personalcommunication.
Prev page--Garden City Site
Kansas Geological Survey, Geohydrology
Placed online Dec. 6, 2007; original report dated Dec. 1999
Comments to webadmin@kgs.ku.edu
The URL for this page is http://www.kgs.ku.edu/Hydro/Publications/1999/OFR99_08/page3.html