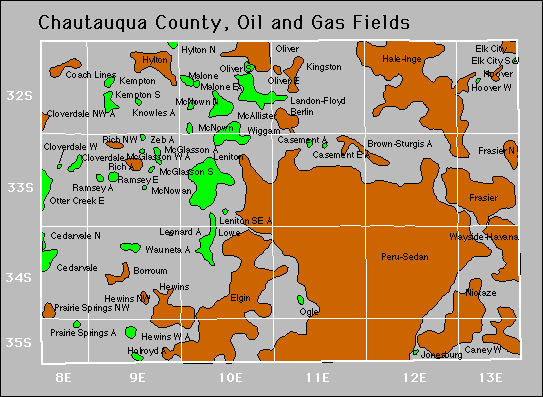
| Year | Oil | Gas | ||||
|---|---|---|---|---|---|---|
| Production (bbls) |
Wells | Cumulative (bbls) |
Production (mcf) |
Wells | Cumulative (mcf) |
|
| 1995 | 424,926 | 1461 | 74,274,024 | 573,061 | 75 | 8,090,335 |
| 1996 | 377,044 | 1409 | 74,651,068 | 465,689 | 65 | 8,556,024 |
| 1997 | 341,741 | 1360 | 74,992,809 | 503,735 | 103 | 9,059,759 |
| 1998 | 268,721 | 1250 | 75,261,530 | 288,692 | 108 | 9,348,451 |
| 1999 | 246,929 | 1089 | 75,508,459 | 583,860 | 123 | 9,932,311 |
| 2000 | 238,947 | 1195 | 75,747,406 | 695,686 | 136 | 10,627,997 |
| 2001 | 218,647 | 1181 | 75,966,053 | 740,565 | 147 | 11,368,562 |
| 2002 | 219,681 | 1149 | 76,185,734 | 661,836 | 135 | 12,030,398 |
| 2003 | 212,559 | 1142 | 76,398,293 | 623,195 | 139 | 12,653,593 |
| 2004 | 208,825 | 1136 | 76,607,118 | 619,374 | 146 | 13,272,967 |
| 2005 | 217,881 | 1090 | 76,824,999 | 626,445 | 139 | 13,899,412 |
| 2006 | 277,192 | 1141 | 77,102,191 | 624,120 | 149 | 14,523,532 |
| 2007 | 251,056 | 1162 | 77,353,247 | 668,397 | 151 | 15,191,929 |
| 2008 | 255,447 | 1166 | 77,608,694 | 751,977 | 187 | 15,943,906 |
| 2009 | 234,787 | 1129 | 77,843,481 | 640,906 | 196 | 16,584,812 |
| 2010 | 242,010 | 1167 | 78,085,491 | 583,593 | 162 | 17,168,405 |
| 2011 | 253,234 | 1193 | 78,338,725 | 553,655 | 142 | 17,722,060 |
| 2012 | 305,059 | 1256 | 78,643,784 | 441,646 | 115 | 18,163,706 |
| 2013 | 291,001 | 1319 | 78,934,785 | 311,100 | 112 | 18,474,806 |
| 2014 | 297,154 | 1320 | 79,231,939 | 262,429 | 98 | 18,737,235 |
| 2015 | 248,631 | 1289 | 79,480,570 | 247,022 | 73 | 18,984,257 |
| 2016 | 210,803 | 1126 | 79,691,373 | 166,752 | 63 | 19,151,009 |
| 2017 | 192,606 | 1113 | 79,883,979 | 127,843 | 55 | 19,278,852 |
| 2018 | 199,877 | 1086 | 80,083,856 | 98,628 | 51 | 19,377,480 |
| 2019 | 171,735 | 1064 | 80,255,591 | 86,115 | 43 | 19,463,595 |
| 2020 | 143,222 | 968 | 80,398,813 | 58,868 | 34 | 19,522,463 |
| 2021 | 136,839 | 1045 | 80,535,652 | 46,235 | 17 | 19,568,698 |
| 2022 | 133,277 | 1058 | 80,668,929 | 44,185 | 16 | 19,612,883 |
| 2023 | 135,091 | 1077 | 80,804,020 | 37,600 | 13 | 19,650,483 |
| 2024 | 111,363 | 991 | 80,915,383 | 26,864 | 12 | 19,677,347 |


| Abandoned | ||
|---|---|---|
| Brown-Sturgis Caney West Hewins Northwest Knowles Leonard |
Mcglasson Mcglasson West Mcnown Ogle Page |
Ramsey Wauneta |
Gas Storage Fields