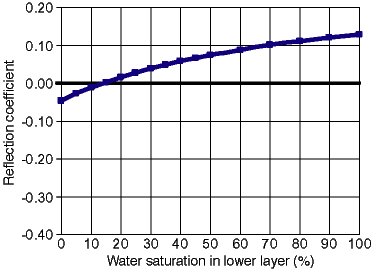
The results of this model are summarized in section 1 of table 4 and are shown in time-lapse sequence in fig. 6A. For a water saturation of 10% in both layers, the two-way travel-time for the entire interval is 13.39 ns and the reflection coefficient is zero (there is no impedance contrast). As fig. 6A illustrates, increasing water saturation in the lower sandstone interval (shown as an increasing blue bar on the water saturation column on the left) results in increased bulk dielectric-constant values in the lower layer (central column), increased two-way travel-time for the entire interval (right column), and increased reflection-coefficient values for the interface (horizontal black bar in right column). For increasing lower-layer water saturations, the two-way travel times for the entire interval increase and reflection coefficients increase in magnitude (fig. 6B). These data indicate that, without stacking, saturation differences between the layers must exceed 15% to produce a reflection coefficient that is above background noise (RC greater than 0.10). Based on Eq. (4), obtaining nine vertical stacks would increase the reflection coefficient to 0.1 (for a 5% difference in water saturation). For single-stack data, with decreasing porosity, the consequent decreased volume of water in the bulk volume requires greater saturation differences between the layers to produce a reflection coefficient above 0.10. Calculations using worksheet 5 (appendix A) indicate that differences in saturation must exceed 35% at 15% porosity; at 5% porosity, even total saturation of the lower layer (Sw = 100%) will not generate sufficient contrast in dielectric-constant values between the layers to produce a reflection coefficient greater than 0.10.
Press Reload to repeat animation
Fig. 6A. Results of TP modeling to show the effects of water saturation on bulk dielectric constant, two-way travel-time (TWT), and reflection coefficient in a 1-m (3.3-ft)-thick, 35% porosity, 100% quartz sandstone with a fixed water saturation of 10% in the upper 0.5 m (1.6 ft) and variable water saturation (10% to 100%) in the lower 0.5 m (1.6 ft). (A) Animation showing the results of TP modeling. Constituent dielectric-constant values are shown in the upper lefthand corner of the plot. Water saturation percentages of the lower 0.5 m (1.6 m) are indicated by the bar on the left side of the plot, and range from 10% to 100%. The middle portion of the plot shows calculated bulk dielectric-constant values versus depth. The right side of the model shows calculated TWT for the two layers and the reflection coefficient from the interface. Data are summarized in table 4.

Fig. 6B. Reflection coefficient at the interface between upper and lower layers versus water saturation of the lower layer in a 1-m (3.3-ft)-thick, 35% porosity, 100% quartz sandstone with a fixed water saturation of 10% in the upper 0.5 m (1.6 ft) and variable water saturation (10% to 100%) in the lower 0.5 m (1.6 ft).
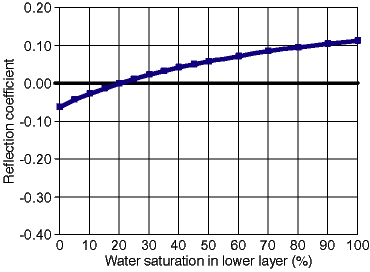
Modeling results are summarized in section 2 of table 4 and are shown in time-sequence in fig. 7A. Total interval two-way travel-times for this model increase from 12.09 ns at 0% water saturation to 26.75 ns at 100% water saturation. Increasing the water saturation of both layers by the same relative percentage of the available porosity produced low reflection-coefficient values that approach a minimum between 10% and 15% water saturation. At 15% water saturation in both layers, the reflection coefficient reverses polarity and reaches a maximum value of 0.13 at 100% water saturation (fig. 7B). The minimum in this series of models reflects the difference in bulk volume water (BVW = ![]() Sw; porosity times saturation) between the layers, although percent water saturation is constant for both layers. Reflection coefficients for these models do not exceed 0.10 except at water saturations greater than 70%, indicating that no significant reflection would occur at the interface between these layers without data stacking. Though not simulated in fig. 7A, most sandstones would be expected to have higher water saturations in the lower layer than in the upper layer due to pore-size-induced differences in capillary pressure. Calculations using worksheet 5 (appendix A) for this model indicate that single-stack reflection-coefficient values exceed 0.10 only at water saturations greater than 35% in the lower layer.
Sw; porosity times saturation) between the layers, although percent water saturation is constant for both layers. Reflection coefficients for these models do not exceed 0.10 except at water saturations greater than 70%, indicating that no significant reflection would occur at the interface between these layers without data stacking. Though not simulated in fig. 7A, most sandstones would be expected to have higher water saturations in the lower layer than in the upper layer due to pore-size-induced differences in capillary pressure. Calculations using worksheet 5 (appendix A) for this model indicate that single-stack reflection-coefficient values exceed 0.10 only at water saturations greater than 35% in the lower layer.
Press Reload to repeat animation
Fig. 7A. Results of TP modeling to show the effects of water saturation on bulk dielectric constant, two-way travel-time (TWT), and reflection coefficient in a 1-m (3.3-ft)-thick, 35% porosity, 100% quartz sandstone with a fixed water saturation of 10% in the upper 0.5 m (1.6 ft) and variable water saturation (10% to 100%) in the lower 0.5 m (1.6 ft). (A) Animation showing the results of TP modeling. Constituent dielectric-constant values are shown in the upper lefthand corner of the plot. Water saturation percentages of the lower 0.5 m (1.6 m) are indicated by the bar on the left side of the plot, and range from 10% to 100%. The middle portion of the plot shows calculated bulk dielectric-constant values versus depth. The right side of the model shows calculated TWT for the two layers and the reflection coefficient from the interface. Data are summarized in table 4.

Fig. 7B. Reflection coefficient at the interface between upper and lower layers versus water saturation of the lower layer in a 1-m (3.3-ft)-thick, 35% porosity, 100% quartz sandstone with a fixed water saturation of 10% in the upper 0.5 m (1.6 ft) and variable water saturation (10% to 100%) in the lower 0.5 m (1.6 ft).
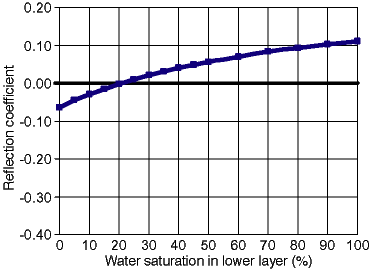
Modeling results are summarized in section 3 of table 4 and are shown in time-sequence in fig. 8A. When water saturation in both layers is 0%, TWT values are 12.52 ns; these values increased to 27.18 ns at 100%, an increase similar to that seen in the two previous scenarios. Increasing water saturation of both layers produced low reflection-coefficient values that approached a minimum at 24% water saturation. At this point, the reflection coefficient reversed polarity and reached a maximum value of 0.11 value at 100% water saturation (fig. 8B). Single-stack reflection-coefficient values did not exceed the 0.10 threshold of Annan (1996) until water saturations exceeded 85%, higher than in the previous quartzose model. As mentioned previously, the lower sandstone layer would be expected to exhibit higher water saturation than the upper. If the model were altered so that the upper layer were at a constant water saturation of 10%, then single-stack reflection-coefficient values would exceed 0.10 only when water saturations in the lower layer were greater than 27%, when the lower layer contains mica (worksheet 5, appendix A).
Press Reload to repeat animation
Fig. 8A. Results of TP modeling to show the effects of water saturation on bulk dielectric constant, two-way travel-time (TWT), and reflection coefficient in a 0.5-m (1.6-ft)-thick, 35% porosity, 100% quartz layer overlying a 0.5-m (1.6-ft)-thick, 20% porosity, 60% quartz, 40% mica layer. Constituent dielectric-constant values are shown in the upper lefthand corner of the plot. Water saturation percentages are indicated by the bar on the left side of the plot, and range from 0% to 100%. The middle portion of the plot shows calculated bulk dielectric constant values versus depth. The right side of the model shows calculated two-way travel-times for the two layers, and the reflection coefficient from the interface. Data are summarized in table 4.

Fig. 8B. Reflection coefficient at interface between upper and lower layers versus water saturation present in both layers in a 0.5-m (1.6-ft)-thick, 35% porosity, 100% quartz layer overlying a 0.5-m (1.6-ft)-thick, 20% porosity, 60% quartz, 40% mica layer.
Kansas Geological Survey
Web version December 3, 2001
http://www.kgs.ku.edu/Current/2001/martinez/martinez6.html
email:lbrosius@kgs.ku.edu