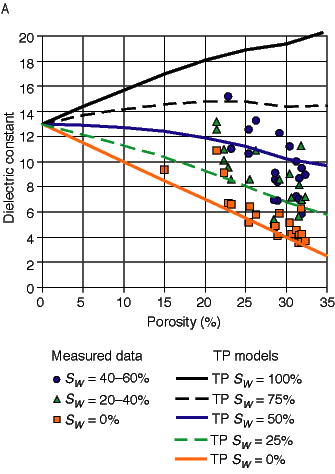
Fig. 9A. Measured dielectric constant versus helium porosity for water saturations of approximately 0% (air-dried), 20Ð40%, and 40Ð60%. The TP-model dielectric-constant curves for different water saturations (orange line shows baseline conditions) are also shown. These values are based on laboratory measurements from Tonganoxie Sandstone estuarine sandstone, shaly sandstone, siltstone, and shale samples.
Time-propagation modeling indicates that dielectric constant decreases with increasing air-filled porosity, increasing amount of quartz in the matrix, and decreasing water saturation. Figure 9A illustrates the relationship between dielectric constant and porosity for samples of varying water saturation. To account for fluid-rock electrochemical interaction due to increasing shaliness and increasing surface area with decreasing porosity, the dielectric constant for the air-dried (and not oven-dried) samples was assumed to represent the dry condition or baseline. This approach, also used by Knight and Endres (1990), accounts for geometric and fluid-rock electrochemical interaction effects on the wetted surface by incorporating them into the dielectric constant of the matrix. Once these effects are accounted for, the TP model provides more accurate prediction of bulk dielectric constant for shaly sands.
Baseline dielectric constants for rock with increasing matrix dielectric constant and decreasing porosity, due to changing mineralogy, ranged from 4.4 (quartzose) at 35% porosity to 13.0 (shale-siltstone) at 0% porosity. Figure 9A shows dielectric-constant curves for four water saturations calculated using TP modeling from baseline conditions (yellow line). Measured dielectric-constant values exhibit a trend with porosity that is roughly consistent with TP model-predicted values. Variance between TP model-predicted values and measured values may be attributed to difficulties in accurately measuring dielectric constants from coarse-grained samples, differences in mineralogy between the sample and the modeled matrix dielectric constant, and differences between actual sample water saturations and modeled curve values.
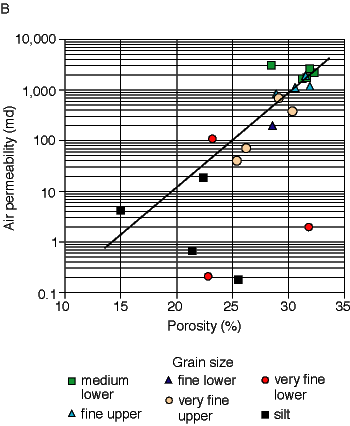
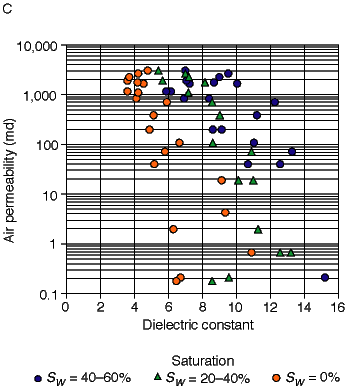
The Tonganoxie estuarine sandstones (excluding siltstones) exhibit a good log-linear correlation between hydraulic (air) permeability and porosity (R2 = 0.92; fig. 9B). Based on the good correlations between hydraulic (air) permeability and porosity and between baseline dielectric constant and porosity, an empirical log-linear correlation between hydraulic permeability and dielectric constant (fig. 9C) indicates that dielectric constant can be used to predict permeability.

Fig. 9B. Hydraulic (air) permeability versus helium porosity, with a log-linear correlation of R2 = 0.92 (line, excludes siltstone samples). These values are based on laboratory measurements from Tonganoxie Sandstone estuarine sandstone, shaly sandstone, siltstone, and shale samples.

Fig. 9C. Dielectric constant for air-dried samples versus hydraulic (air) permeability. These values are based on laboratory measurements from Tonganoxie Sandstone estuarine sandstone, shaly sandstone, siltstone, and shale samples.
Kansas Geological Survey
Web version December 3, 2001
http://www.kgs.ku.edu/Current/2001/martinez/martinez7.html
email:lbrosius@kgs.ku.edu