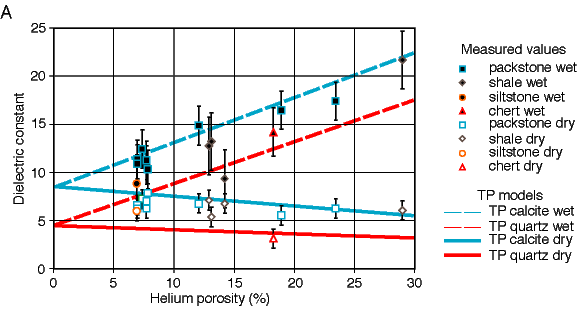
Dielectric-constant values were predicted by TP modeling for rock with a calcite (![]() = 8.0) and quartz (
= 8.0) and quartz (![]() = 4.5) matrix and were simulated over the range of porosity values exhibited by the data (
= 4.5) matrix and were simulated over the range of porosity values exhibited by the data (![]() = 0% to 25%). The calculated values were plotted with the measured data (fig. 10A). Packstone samples that exhibited bulk dielectric-constant values less than the TP model-predicted values for a pure calcite (
= 0% to 25%). The calculated values were plotted with the measured data (fig. 10A). Packstone samples that exhibited bulk dielectric-constant values less than the TP model-predicted values for a pure calcite (![]() = 8.0) matrix contained varying amounts of quartz in the matrix in the form of increasing argillaceousness or chert. Incorporating matrix composition and porosity in the TP model-predicted values provided a better correlation with measured dielectric-constant values (standard error of prediction of 0.58) than the correlation with the calcite and quartz matrix trends evident in fig. 10A.
= 8.0) matrix contained varying amounts of quartz in the matrix in the form of increasing argillaceousness or chert. Incorporating matrix composition and porosity in the TP model-predicted values provided a better correlation with measured dielectric-constant values (standard error of prediction of 0.58) than the correlation with the calcite and quartz matrix trends evident in fig. 10A.

Fig. 10A. Dry and water-saturated dielectric constant versus helium porosity. These values are based on laboratory measurements from carbonate samples collected at the Martinez, Kruger et al. (1998) study site. The TP-model results for wet and dry calcite (![]() = 8.5) and quartz (
= 8.5) and quartz (![]() = 4.5) are also shown.
= 4.5) are also shown.
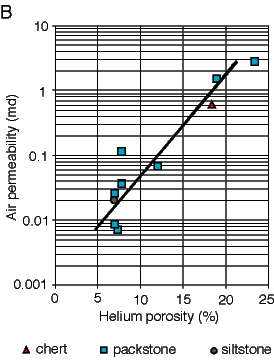
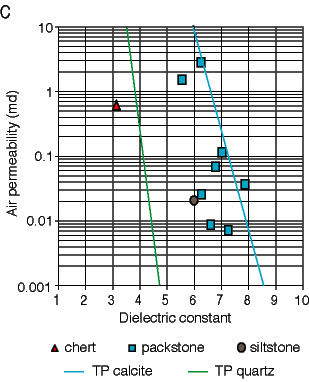
These carbonate rocks exhibited a good log-linear correlation between hydraulic (air) permeability and porosity (R2 = 0.87; fig. 10B). However, the complexity of the relationship between dielectric constant and porosity, introduced by mineralogy (evident in fig. 10A) and sample heterogeneity, significantly weakens the correlation between dielectric constant and hydraulic (air) permeability (fig. 10C). Multivariate regression, using both dielectric constant and amount of quartz in the matrix, would improve the correlation, but not enough samples were studied for this analysis to be meaningful on this data set.

Fig. 10B. Hydraulic (air) permeability versus helium porosity, with a log-linear correlation of R2 = 0.8743 (line). These values are based on laboratory measurements from carbonate samples collected at the Martinez, Kruger et al. (1998) study site.

Fig. 10C. Dry and water-saturated dielectric constants versus hydraulic (air) permeability. These values are based on laboratory measurements from carbonate samples collected at the Martinez, Kruger et al. (1998) study site.
Kansas Geological Survey
Web version December 3, 2001
http://www.kgs.ku.edu/Current/2001/martinez/martinez8.html
email:lbrosius@kgs.ku.edu