


Kansas Geological Survey, Open-file Report 98-20
Part of the Well Tests for Site Characterization Project
The Dipole Flow Test for Site Characterization: Some Practical Considerations
James J. Butler, Jr., John M. Healey
Kansas Geological Survey
1930 Constant Avenue, Campus West
University of Kansas
Lawrence, KS 66047
|
|
Vitaly A. Zlotnik and Brian R. Zurbuchen
Department of Geosciences
University of Nebraska at Lincoln
Lincoln, NE 68588
|
KGS Open-File Report 98-20
Prepared for presentation at
The American Geophysical Union
Spring Meeting in Boston, Massachusetts
May 29, 1998
Abstract
The dipole flow test (DFT) is a promising approach for the estimation of
vertical variations in hydraulic conductivity. This technique is a
single borehole test in which a three-packer tool is placed in the
screened (open) interval of a well. A small downhole pump moves water
from one chamber of the tool to the other through the center of the
middle packer, thereby setting up a circulation pattern in the adjacent
formation. The head difference between the two chambers at steady state
is used to estimate the hydraulic conductivity (K) of near-well portions
of the formation. Recent work at sites in Kansas and Nebraska has been
directed at examining several issues of relevance for practical field
applications: the time required to obtain steady state and its
dependence on the characteristics of the formation and test equipment,
the impact of well installation and development procedures, the
dependence of K estimates on pumping rate, and the applicability of the
method to heterogeneous systems. Results show that the DFT is
particularly useful in high-K media because the time to steady state is
short (a matter of seconds) and non-Darcian head losses are negligible.
Although the approach is based on the assumption of a locally
homogeneous formation, comparisons of DFT-determined K profiles with
geophysical logs indicate that the DFT can provide useful information in
highly heterogeneous systems as well.
Introduction
Numerous field and theoretical studies have shown that spatial
variations in hydraulic conductivity (K) play a critical role in the
transport of contaminants in the subsurface. Unfortunately, the
identification of these variations on a scale of relevance for
contaminant transport investigations has proven to be a difficult task.
A wide variety of approaches for obtaining information about spatial
variations in K have been reported in the literature. These include
slug tests (Butler, 1997), borehole flowmeter surveys (Boman et al.,
1997), laboratory core analyses (Burger and Belitz, 1997), geophysical
surveys (Hubbard et al., 1997), and various tracer-based methods (Molz
et al., 1988). This presentation describes the field testing of a
promising alternative to these approaches, the dipole flow test.
The dipole flow test (DFT) is a single-well hydraulic test for
characterizing variations in hydraulic conductivity along the screened
(open) interval of a well. This approach, which was first proposed by
Kabala (1993), involves use of the three-packer tool depicted in Figure
1. A pump in the central pipe of the middle packer transfers water from
the upper chamber to the lower one, setting up a recirculatory pattern
in the adjacent formation. Zlotnik and Ledder (1994, 1996) and Zlotnik
and Zurbuchen (1998) developed theory, equipment, and field methodology
for the DFT. They found that the radial component of hydraulic
conductivity (Kr) can be estimated from the total head change
( ) in the upper and lower
chambers at steady state using the following approximate formula:

where
- a = anisotropy ratio, (Kr/Kz)0.5;
- Kz = vertical component of hydraulic conductivity, [L/T];
 = dipole shape
function, ranges from 0.5 to 1.0 depending on
 (L/
(L/ ratio),
[dimensionless].
Figure 1. Schematic of the dipole flow test.

The vertical variation in Kr along the well screen can be
estimated through a series of dipole flow tests between which the tool
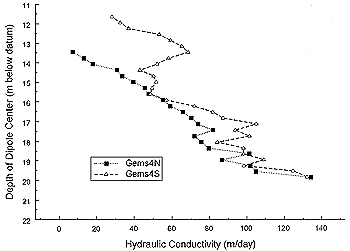
is moved a short distance along the well screen. Figure 2 is an example
of Kr profiles that were produced by DFT surveys. As Zlotnik
and Zurbuchen (1998) emphasize, the DFT has several important advantages
for field applications. These include 1) no water is added or removed
from the well during a test program, 2) the scale of the region
influenced by the test can be readily defined and controlled, 3)
Kr estimates can be obtained using a simple formula (eqn.
(1)) that does not require optimization methodology and which is
applicable adjacent to and at a distance from boundaries in the vertical
plane, and 4) relatively low flow rates can be used in high K media so
that the well losses associated with other methods are avoided.
Figure 2. Dipole depth versus hydraulic conductivity--10/97
dipole flow tests at Gems4N and Gems4s.
A larger version of this figure is available.
The purpose of this presentation is to discuss an intensive program of
field testing directed at assessing the practical utility of the DFT.
The research site at which this work was performed will first be
described, after which a series of practical considerations for the DFT
will be discussed.
Field Site
This program of field testing was carried out at sites in Kansas and
Nebraska. The primary focus of this presentation will be on work done
at the Geohydrologic Experimental and Monitoring Site (GEMS), a Kansas
Geological Survey (KGS) research area in the Kansas River valley just
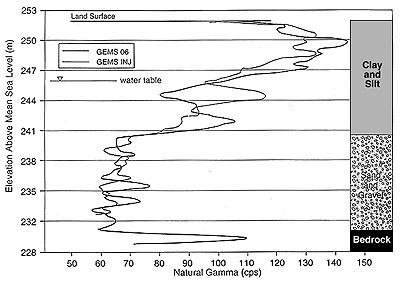
north of Lawrence, Ks (Fig. 3). The shallow subsurface at GEMS consists
of an alluvial facies assemblage of approximately 21.3 m in thickness.
The upper half is primarily clay and silt, while the lower half, the
focus of this work, is composed of coarse sand and gravel (Fig. 4). The
field testing described in this presentation was performed at the wells
labelled Gems4N and Gems4S (rw=0.051 m for both) on Figure 3.
Note that the clay and silt interval acts as a confining unit during
hydraulic tests performed in the sand and gravel section.
Figure 3. Location map for Geohydrologic Experimental and Monitoring
Site (GEMS).
A larger version of this figure is available.
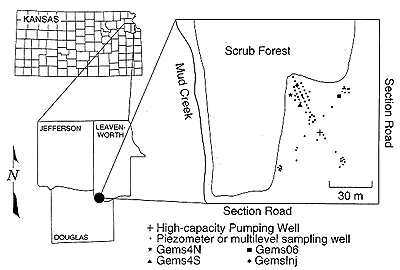
Figure 4. GEMS stratigraphy and natural gamma logs.
A larger version of this figure is available.
The dipole flow tests were performed with a tool
(Fig. 1) designed and
fabricated at the University of Nebraska (Zlotnik and Zurbuchen, 1998).
Pressure transducers were placed in the upper and lower chambers
(transducers labelled UT and LT on Fig. 1, respectively) to measure
 . A control transducer (CT) was
placed above the tool to detect short circuiting through fittings in the
upper packer or along a near-well disturbed zone.
In the following sections, a series of practical considerations for the
DFT will be discussed.
Practical Considerations: Time to Steady State
The analysis method (eqn. (1)) proposed by Zlotnik and Ledder (1996)
uses the steady-state drawdown to estimate Kr. Zlotnik and
Ledder (1994) show that the time required to reach steady-state
conditions (ts) can be defined as:
ts > 10SsL2/Kz
For the confined aquifer at GEMS (relatively low specific storage
(Ss) and high Kz), one would expect a
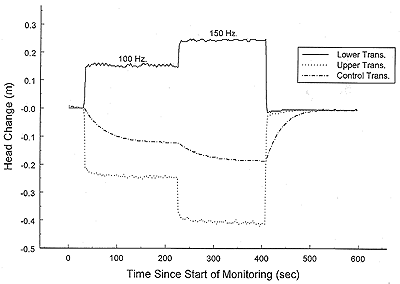
ts on the order of seconds. Figure 5 displays a record of
head change versus time for one of the more permeable test intervals.
As shown, the time to steady state for all three pumping rates was a
matter of a few seconds. Note that the pumping rate is given in
frequency (Hz), which corresponds to the setting on the Grundfos
Redi-Flo2 pump used in the dipole tool. The relationship between pump
frequency and flow rate depends on back pressure. In this case, a
frequency of 100 Hz corresponds to a pumping rate of 14.3
m3/day (2.6 gpm). Figure 6 displays a similar record for a
less permeable section. Again, ts is on the order of a few
seconds. In this case, the control transducer indicates that there is
some water transfer from the overlying water column in the well, either
through the fittings of the upper packer or along a near well disturbed
zone. However, as shown in the figure, the impact of that transfer on
the steady-state drawdown was negligible. Note that further tests
indicated that movement through the packer fittings was the most likely
mechanism for the water transfer.
Figure 5. 10/30/97 Gems4N. Dipole center at 17.74 m.
A larger version of this figure is available.
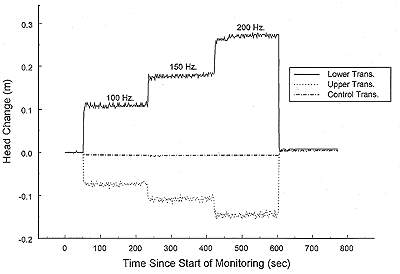
Figure 6. 10/30/97 Gems4N. Dipole center at 14.69 m.
A larger version of this figure is available.
Practical Considerations: Dependence on Flow Rate
The analysis method of Zlotnik and Ledder (1996) is based on the
assumption that the normalized steady-state drawdown
( /Q) is only a function
of the hydraulic
conductivity of the formation and test geometry, i.e. head losses
associated with water movement into and through the dipole tool (well
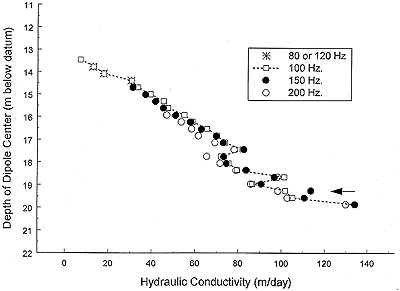
losses) can be neglected. Figure 7 depicts the results of a series of
tests to assess the appropriateness of that assumption. In this series
of tests, the flow rate was varied from 80-200 Hz (10.4 m3/d
(1.9 gpm) - 28.9 m3/d (5.3 gpm)). In most cases, the
variation in Kr with Q was quite small. The largest
variation in Kr (98-114 m/d) was seen at the level marked by
the arrow on Figure 7. In this case, the variation was a product of
sensor noise, primarily in the upper transducer (the closest transducer
to the pump). This noise was greatest at the 200 Hz setting, so, as a
result of the methodology used to estimate
 in these experiments, that setting tended to produce
slightly lower Kr estimates. In most cases, however, these
Q-induced variations in Kr have little practical
significance. Note that there was no indication that well losses had a
significant effect on any of the Kr estimates obtained in
this program of field testing.
Figure 7. Dependence on flow rate. Hydraulic conductivity versus
depth--Gems4N 10/30/97 test.
A larger version of this figure is available.
Practical Considerations: Well Development
The analysis methodology for the DFT is based on the assumption that the
K of the material immediately adjacent to the test interval is the same
as the bulk average K of the formation. In reality, however, a
considerable amount of fine debris will be concentrated in the near-well
portions of the formation as a result of the drilling process. One of
the primary goals of well development is to remove this
drilling-generated material from the formation. In this work, a series
of experiments were performed to assess the impact of well development
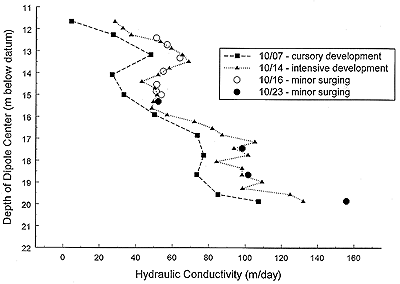
on DFT estimates. Figure 8 displays the results of DFT surveys
performed at Gems4S after varying degrees of well development. The
cursory development consisted of pumping the well at a constant rate
until an approximately clear stream of water was obtained (20 mins).
The intensive development consisted of stressing discrete intervals via
pumping and surging. The final two phases of development consisted of
small amount of surging followed by pumping to remove the debris brought
into the well. At Gems4S, the intensive development produced an upward
shift in the magnitude of the Kr estimates but little change
in the profile shape. The final two stages of surging produced little
change in Kr except at the bottom of the well where fine
material that had accumulated during previous development activity was
removed.
Figure 8. Dependence on well development. Hydraulic conductivity versus
depth--Gems4S 10/97 test.
A larger version of this figure is available.
Gems4S was drilled using the hollow-stem auger method; no significant
problems were encountered in the drilling and installation process.
Gems4N was also drilled using the same technique. At this well,
however, a miscalculation by the driller resulted in significant amounts
of clay and silt from the upper section (see Fig. 4)
being smeared
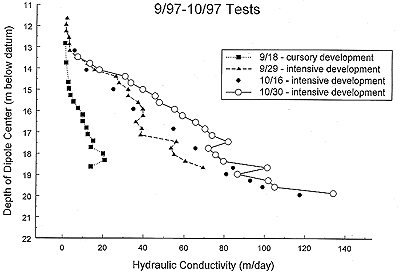
across the sand and gravel interval. Figure 9 displays the results of
DFT surveys performed at Gems4N after varying degrees of well
development. The steps in the well development were similar to those
used at Gems4S, except that three stages of intensive development were
required to diminish the impact of the driller-induced smearing. In
this case, well development significantly altered both the magnitude and
pattern of the Kr estimates. Clearly, well installation and
development is an important component of a DFT survey.
Figure 9. Dependence on well development. Hydraulic conductivity versus
depth--Gems4N 9/97-10/97 tests.
A larger version of this figure is available.
In the preceding paragraphs, the focus was on diminishing the impact of
a near-well zone of relatively low K. In the case of an artificial
filter pack, however, the near-well K may be considerably greater than
that of the formation. Kabala and Xiang (1992) present results of
numerical simulations that indicate that a near-well zone of relatively
high K can introduce error into DFT estimates. This error, which is
primarily a function of the width and relative K of the filter pack, and
tool geometry, can be significantly reduced through tool design and use
of appropriate well installation procedures. In unconsolidated
formations, natural filter packs should be utilized whenever possible.
Note that natural filter packs were used at both Gems4S and Gems4N.
Practical Considerations: Heterogeneous Formations
The DFT analysis methodology is based on the assumption of a homogeneous
formation. The profiles displayed in Figure 2
indicate that this
assumption may not be appropriate at Gems4N and Gems4S. Indelman and
Zlotnik (1997) assessed DFT-induced flow in certain types of stratified
formations. Their work, however, is limited to the case of vertical K
variations that are relatively small and are statistically stationary.
Thus, the appropriateness of DFT estimates in more realistic
configurations (e.g., formations with large-scale trends) has not yet
been addressed. One of the major purposes of this project was to
compare DFT estimates with those obtained from multi-level slug tests
and borehole flowmeter surveys. Zlotnik et al. (1998, poster H52C-2)
present preliminary results of that work. Although that work is ongoing
at GEMS, some insight into the viability of the DFT in heterogeneous
systems can be gained through comparison of DFT profiles with natural
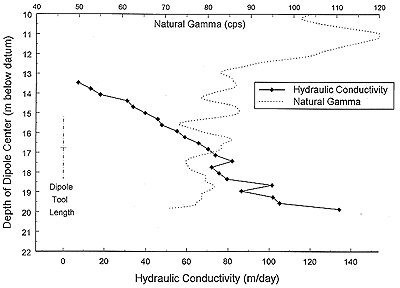
gamma logs. Figures 10 and 11 display the final profiles from Gems4S
and Gems4N, respectively, with natural gamma logs from those two wells.
The dipole tool length, which is displayed on the right hand side of
both figures, serves as an approximate measure of the vertical zone of
influence of a DFT (Zlotnik and Ledder, 1996). Note that the general
shape of the Kr profiles can largely be explained by the
patterns displayed by the natural gamma logs. Thus, although the
magnitude of the Kr estimates has undoubtedly been affected
by the assumption of homogeneity, the shape of the DFT profiles provides
considerable information about the heterogeneous structure of the
formation.
Figure 10. Hydraulic conductivity and natural gamma profiles--Gem4S.
A larger version of this figure is available.
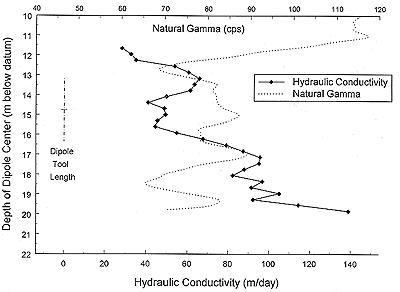
Figure 11. Hydraulic conductivity and natural gamma profiles--Gem4N.
A larger version of this figure is available.
Conclusions
The identification of spatial variations in hydraulic conductivity on a
scale of relevance for transport investigations has proven to be a
considerable challenge. The dipole flow test is a promising approach
for the estimation of vertical variations in hydraulic conductivity
along the screened (open) interval of a well. This presentation
described a series of experiments directed at assessing the practical
applicability of this method in field settings. The results of this
field assessment indicate that the dipole flow test has considerable
potential for providing valuable information about vertical variations
in hydraulic conductivity. However, as with all types of single-well
hydraulic tests, well installation and development procedures will have
a significant influence on the quality of the information obtained with
this technique.
Acknowledgement
This research was supported in part by a grant from the Regional Water
Resources Competitive Grants Program of the United States Geological
Survey (USGS). Any opinions, findings, and conclusions or
recommendations expressed in this materials are those of the authors and
do not necessarily reflect the views of the USGS.
References
Boman, G.K., Molz, F.J., and K.D. Boone, 1997, Borehole flowmeter
applications in fluvial sediments: Methodology, results, and assessment,
Ground Water, 35(3), 443-450.
Burger, R.L., and K. Belitz, 1997, Measurement of anisotropic hydraulic
conductivity in unconsolidated sands: A case study from a shoreface
deposit, Oyster, Virginia, Water Resources Research, 33(6), 1515-1522.
Butler, J.J., Jr., 1997, The Design, Performance, and Analysis of Slug
Tests, Lewis Pub., Boca Raton, 252 pp.
Hubbard, S.S., Rubin, Y., and E.L. Majer, 1997,
Ground-penetrating-radar-assisted saturation and permeability
estimation in bimodal systems, Water Resources Research, 33(5), 971-990.
Indelman, P., and V.A. Zlotnik, 1997, Average steady nonuniform flow in
stratified formations, Water Resources Research, 33(5), 927-934.
Kabala, Z.J., 1993, The dipole flow test: A new single-borehole test for
aquifer characterization, Water Resources Research, 29(1), 99-107.
Kabala, Z.J., and J. Xiang, 1992, Skin effect and its elimination for
single-borehole aquifer tests, in T.F. Russell et al. (eds.),
Computational Methods in Water Resources IX, Vol. 1, Elsevier, New York,
467-474.
Molz, F.J., Guven, O., Melville, J.G., Nohrstedt, J.S., and J.K.
Overholtzer, 1988, Forced-gradient tracer tests and inferred hydraulic
conductivity distributions at the Mobile site, Ground Water, 26(5),
570-579.
Zlotnik, V.A., and G. Ledder, 1994, Effect of boundary conditions on
dipoleflow, in A. Peters et al. (eds.), Computational Methods in Water
Resources X, Vol. 2, Kluwer Academic, Dordrecht, 907-914.
Zlotnik, V.A., and G. Ledder, 1996, Theory of dipole flow in uniform
anisotropic aquifers, Water Resources Research, 32(4), 1119-1128.
Zlotnik, V.A., and B.R. Zurbuchen, 1998, Dipole probe: Design and field
application of a single-borehole device for measurements of small-scale
variations of hydraulic conductivity, Ground Water, in press.
Zlotnik, V.A., Zurbuchen, B.R., Butler, J.J., Jr., and J.M. Healey,
1998, Field comparison of single-borehole hydraulic testing methods for
estimating vertical K-profiles in highly permeable aquifers: Preliminary
results, Eos, 79(17s), S153.
Kansas Geological Survey
Updated Nov. 25, 1998
Comments to webadmin@kgs.ku.edu
The URL for this page is HTTP://www.kgs.ku.edu/Hydro/Publications/OFR98_20/index.html
![]() ) in the upper and lower
chambers at steady state using the following approximate formula:
) in the upper and lower
chambers at steady state using the following approximate formula:

